Carbon Peak and Carbon Neutralization Information Support Platform
碳达峰碳中和情报支持平台
在列表中检索
America's ethanol industry has been in a state of rapid evolution since the beginning of 2000. Record-setting production, policy development, and market expansion have all moved forward with dramatic speed and helped to create the world's largest, most efficient, most cost effective renewable fuels industry. However, developments in 2011 have set the stage for a new chapter in American ethanol history. Here are the Top 5 stories of 2011 as seen through the eyes of the Renewable Fuels Association. 1. EPA gives final approval to E15 for MY2001 and newer vehicles. For the first time ever, Americans driving conventional vehicles will be provided the opportunity to choose ethanol blends in excess of 10 percent. While a strong argument could be made for the end of the tax incentive as the year's top story, the impact of an expanded market through E15 blends will have an exponentially greater impact on the U.S. ethanol market than the temporary adjustment caused by the end of VEETC. 2. End of VEETC and the secondary tariff. Without protest, U.S. ethanol producers allowed the $0.45 per gallon tax incentive for ethanol blending to expire. The offsetting secondary tariff on imported ethanol will also expire. The domestic ethanol industry has evolved, policy has progressed, and the market has changed making now the right time for the incentive to expire. Ethanol producers never intended for the tax incentive to be permanent. Like all incentives, it was put in place to help build an industry and when successful, it should sunset. Unfortunately, the same mentality does not extend to century-old tax subsidies supporting 20 th century petroleum technologies. 3. U.S. exports set all-time highs. As the U.S. worked to move beyond artificial barriers in the domestic market, new international markets emerged as opportunities for domestic ethanol producers. An estimated one billion gallons of denatured and undenatured ethanol – gallons never blended with gasoline or eligible for the tax incentive – were exported in 2011. Additionally, U.S. exports of ethanol feed co-products, largely distillers grains, also surged. An estimated 8-9 million metric tons of this high value livestock feed was exported in 2011. 4. Restarting the advanced and cellulosic ethanol engine. Weathering the economic collapse of 2008, advanced and cellulosic ethanol producers made big strides in 2011 to bring these promising technologies to commercial production. A number of advanced and cellulosic ethanol companies, including Abengoa, Coskata, and Mascoma are beginning construction on ethanol biorefineries that will expand America's ability to fuel its economy with a broader range of renewable feedstocks. (An RFA side note: The formation of the Advanced Ethanol Council in partnership with the RFA was a pivotal step forward in forcefully and effectively advocating for the accelerated commercialization of advanced and cellulosic ethanol technologies.) 5. Emergence of the integrated biorefinery model. Ethanol production is far more than fuel and feed. Today, approximately 40 percent of all ethanol facilities are capturing and selling corn oil. An ever-increasing number of ethanol producers are also deploying technologies to produce proteins, biochemicals and other co-products that can further displace oil in marketplace. Anything made from oil can be made from biomass. It is matter of know-how and American ethanol producers are proving that it can be done and be done at scale. It is these five developments that defined 2011 and are setting the stage for 2012 and beyond. In the first week of January, the RFA will be publishing a companion piece to this that looks at the Top 5 stories to watch for U.S. ethanol in 2012. Until then, Happy Holidays from the dedicated staff of the Renewable Fuels Association!
发布时间:2011-12-21 Renewable Fuels AssociationAn in-depth analysis of U.S. land use patterns released today by the U.S. Department of Agriculture shows total cropland decreased by 34 million acres from 2002 to 2007, the lowest level since USDA began collecting this data 1945. The USDA report also shows significant increases in forestland, grassland and rangeland during the five-year period. The Renewable Fuels Association (RFA) said the new report is one more addition to the mounting body of evidence that proves increased ethanol production has not resulted in expansion of total U.S. cropland or a decline in grassland and forest. Using real data from the real world, this report from USDA shows yet again that U.S. cropland is not expanding in response to increased ethanol demand. The report also shows that forest and grassland increased dramatically during a period when ethanol production more than tripled. This is more proof that the wild predictions of ethanol causing cropland expansion and conversion of forest and grassland are just plain wrong. Meanwhile, the report shows land dedicated to urban areas and special-use areas (roads, industrial areas, rural residences, etc.) increased dramatically. It is ironic that the land use debate has fixated on biofuels, when the actual culprit of land conversion has clearly been urban and suburban sprawl. Subdivisions full of mini-mansions, big box stores, shopping malls, and parking lots are encroaching on productive farmland across the country. According to the authors, "Urban land acreage quadrupled from 1945 to 2007, increasing at about twice the rate of population growth over this period. Land in urban areas was estimated at 61 million acres in 2007, up almost 2 percent since 2002 and 17 percent since 1990 (after adjusting the 1990 estimate for the new criteria used in the 2000 Census)." The estimated acreage of grassland pasture and range increased by 27 million acres (almost 5 percent) between 2002 and 2007, while forest-use land increased 20 million acres (3 percent) from 2002 to 2007, "continuing a trend that became evident in 2002 and reversing an almost 50-year downward trend." RFA encourages the policymakers and regulators responsible for penalizing crop-based biofuels for indirect land use change to take a close look at the new USDA report. There is simply no substitute for real data. Our renewable energy policies and regulations should be based on what is actually happening on the ground, not on hypothetical results from black box economic models. The USDA report is available here. *Special-use areas include highways, railroads, airports, defense, industrial, parks and other land uses.
发布时间:2011-12-21 Renewable Fuels AssociationEnergy Deputy Secretary Daniel Poneman spoke at the Tokyo American Center today about nuclear power after Fukushima. Excerpts and full text of remarks, as prepared for delivery, are below: “As two of the nations responsible for pioneering the peaceful use of atomic energy, the United States and Japan share an opportunity – and a responsibility – to safely speed that transition. In fact, next week in the United States we will celebrate the 60th anniversary of the Experimental Breeder Reactor 1 in Idaho, which marked the first time that peaceful atomic energy was used to generate electricity. Our two nations are well positioned to build on this rich history as we look to benefit from the global economic and export opportunities in this field.” “For decades, we have worked in close partnership with Japan on nuclear issues, ranging from preventing the proliferation of nuclear weapons and confronting North Korea, to power generation and operational safety at civil nuclear plants, to deep commercial ties and industrial cooperation between Japanese and American companies.” “The accident at Fukushima reminded the world of what we already knew – that nuclear safety must be our top priority, and that a nuclear accident anywhere is a nuclear accident everywhere. Any nuclear accident generates consequences around the world, and therefore it is our responsibility as a global community to learn from Japan’s experience.” “As one of the few large-scale, carbon-free sources of energy available for deployment today, safe, secure nuclear power is an important part of that puzzle. Nuclear power can help meet the growing global demand for clean energy while creating new jobs, growing our economies, and at the same time, making our countries more energy secure.” “This offers an important economic opportunity for the U.S.-Japan partnership in the global nuclear industry. By continuing to play a leading role globally, our companies can work together in ways that create new jobs and spur innovation in both nations.” Deputy Secretary Poneman’s full remarks, as prepared for delivery, HERE.
发布时间:2011-12-15 Office of Nuclear Energy(NE)There's a hot new craze called the "Ethanol Shuffle" that's sweeping seaports from Sao Paulo to Los Angeles and Houston to Maceio. It's not a new dance for longshoremen and ship captains; no, this is a shuffle of an entirely different sort. This shuffle is all about the confounded realignment of the global ethanol trade. The rearrangement is occurring exclusively as the result of state and Federal fuel regulations that treat Brazilian sugarcane ethanol as if it were the Holy Grail of biofuels. Both the California Air Resources Board (CARB) and U.S. EPA have decided that producing sugarcane ethanol results in fewer lifecycle greenhouse gas emissions than producing corn ethanol. They've bought into the hype that sugarcane ethanol is somehow better and cleaner than corn ethanol, and they've used questionable analyses to support their positions. For example, EPA's land-use change analysis for the Renewable Fuel Standard (RFS2) mysteriously concluded that sugarcane ethanol expansion won't induce any land-use change emissions in Brazil, despite the fact that sugarcane acreage there has doubled in the past decade (an issue we discussed in detail here). Meanwhile, EPA's analysis suggested about two-thirds of the land-use change emissions hypothetically resulting from U.S. corn ethanol expansion come from land conversions in Brazil. Go figure. CARB's analysis of sugarcane ethanol is full of similarly questionable assumptions. For instance, CARB allows Brazilian ethanol producers to claim that their sugarcane was mechanically harvested, when much of the sugarcane crop is still manually harvested after burning the field (a practice that releases significant GHG emissions). CARB also assumes sugarcane ethanol is transported from remote sugar mills to export terminals exclusively by rail and pipeline, when everyone knows trucks carry the majority of cane ethanol to market (this is important because emissions from transportation of the fuel are included in the overall carbon footprint, and shipping ethanol by rail and pipeline emits far fewer GHGs than shipping it by truck). So, under CARB's Low Carbon Fuels Standard (LCFS), sugarcane ethanol generates far more credits for compliance than corn ethanol. And EPA considers sugarcane ethanol to be an "advanced biofuel," meaning it is one of only two options available to obligated parties today for compliance with the RFS2 advanced biofuels requirement (biodiesel being the other). In short, the LCFS and RFS2 strongly compel regulated parties (typically oil refiners) to import sugarcane ethanol to meet their regulatory obligations. But here's the rub: sugarcane ethanol is in short supply after consecutive disappointing sugar crops in Brazil. Sugarcane yields in 2011 were about 19% below the 30-year trend and on par with average yields from the mid-1980s. USDA's attaché on the ground in Brazil estimates the country will produce just 5.8 billion gallons of ethanol in 2011/12, down 20% from last year's 7.2 billion gallons. The shortage of sugar resulting from three consecutive years of declining cane yields means Brazil's ethanol output hasn't been able to keep up with domestic demand—let alone demand from traditional cane ethanol importers like the European Union. In fact, Brazil cut its mandatory nationwide ethanol inclusion level from a 25% blend to 20% because the domestic supply just isn't there and sugarcane ethanol prices have been sky-high. Certainly, the subtext of Brazil's cut to its blend rate is that they simply don't want to dramatically increase imports of U.S. ethanol—apparently, they'd rather import (lots) more gasoline. Given the sugar/ethanol shortage situation in Brazil, one wouldn't expect to see the country exporting much—if any—sugarcane ethanol to the U.S., right? They need to keep every drop for themselves, right? Wrong...the U.S. imported nearly 40 million gallons of sugarcane ethanol for fuel use from Brazil from July through October, with much of the product coming in through the ports of Los Angeles and San Francisco. The volumes were imported strictly for compliance with RFS2 Advanced Biofuel standard and the California LCFS, as there would be absolutely no economic reason to import sugarcane ethanol otherwise. Meanwhile, the U.S. exported 123 million gallons of corn ethanol to Brazil during the same four months to offset the volumes they sent to us and to meet additional demand resulting from their shortage situation. So, that's how the "Ethanol Shuffle" works. California imports sugarcane ethanol from Brazil rather than corn ethanol from Nebraska or Kansas; and in turn, corn ethanol from the Midwest travels to Houston or Galveston via rail, then is shipped to Brazil via tanker to "backfill" the volumes they sent to the U.S. Picture the irony of a tanker full of U.S. corn ethanol bound for Brazil passing a tanker full of cane ethanol bound for Los Angeles or Miami along a Caribbean shipping route. Remember, this is all being done in the name of reducing GHG emissions. But what are the real GHG implications of the shuffle? And what are the economic impacts? Fuel Prices Despite the ridiculously misleading claims of the Brazilian sugar industry (and most recently the Brazil-U.S. Business Council), Brazilian sugarcane ethanol has been far more expensive than U.S. corn ethanol over the past two years. According to the California Energy Commission (CEC), Brazilian sugarcane ethanol was, on average, $1.56/gallon more expensive than corn ethanol delivered from the Midwest through the first eight months of 2011 and $1.04/gallon more expensive in 2010 (see slide 13). In April, Brazilian ethanol was running $3/gallon higher than U.S. corn ethanol even before transportation costs are factored in! The CEC data means E10 made with imported Brazilian ethanol would theoretically be nearly 16 cents/gallon more expensive on average in California than E10 made with ethanol from the Midwest. In other words, a one-day supply of E10 made from Brazilian sugarcane ethanol would cost the state's drivers $5.8 million more than the same amount of E10 made from Midwest corn ethanol (the state burns through about 38 million gallons of E10 per day). Looked at another way, the average California household would spend about $130 more on gasoline over the course of a year if that gasoline was E10 made with sugarcane ethanol rather than U.S. corn ethanol. Yet, the Brazil-U.S. Business Council furtively says importing more cane ethanol would somehow result in "...increased savings at the gas pump for U.S. drivers." Hmmm, how does that work? As a result of tightening annual LCFS carbon intensity targets, CARB expects much less corn ethanol will be used in California in coming years and substantially more cane ethanol will be imported. If the current pricing differential between U.S. ethanol and Brazilian ethanol continues (or widens), the cost to California drivers of the transition to cane ethanol could be tremendous. GHG Emissions Some in California may argue that the GHG reductions associated with using more cane ethanol in the state would justify the incremental cost to consumers. Of course this argument ignores the fact that GHG emissions are global in nature; that is, the net impact to atmospheric CO2 levels is really no different whether the sugarcane ethanol is used in L.A. or in Rio de Janeiro. In fact, using sugarcane ethanol in L.A. instead of in Rio is actually worse for the climate because of the additional emissions associated with transporting the product from Brazil to California and backfilling the volume with U.S. corn ethanol. Using CARB's own transportation distances and emissions factors, we looked at the emissions impacts of two scenarios: one in which California demand is met with corn ethanol from Nebraska and Brazilian demand is met with Brazilian sugarcane ethanol (Scenario A), and one in which California demand is satisfied with Brazilian ethanol and Brazilian demand is met with U.S. ethanol (Scenario B). We find that transportation-related GHG emissions more than double in the scenario where California imports Brazilian cane ethanol and Brazil "backfills" with U.S. corn ethanol imports (Scenario B). And the miles traveled in Scenario B are more than eight times the miles traveled in Scenario A. (Note: Again, CARB curiously assumes cane ethanol travels only by rail (50%) and pipeline (50%) inside of Brazil. While we disagree with this assumption, we've adopted it here for the ease of comparison.) Scenario A: Rational Market Miles CO2e emissions (g/megajoule) California demand met with corn ethanol from central Nebraska Rail (NE ethanol plant to CA terminal) 1,350 1.96 Truck (Distribution from CA terminal) 50 0.40 Subtotal 1,400 2.36 Brazil demand met with sugarcane ethanol from Center-South, Brazil Pipeline (50% of ethanol from sugar mill to terminal) [500 x .5 = 250] 250 0.22 Rail (50% of ethanol from sugar mill to terminal) [500 x .5 = 250] 250 0.36 Truck (Distribution from terminal) 50 0.40 Subtotal 550 0.99 Grand Total Scenario A 1,950 3.35 Scenario B: "LCFS Shuffling" Miles CO2e emissions (g/megajoule) California demand met with sugarcane ethanol from Center-South, Brazil Pipeline (50% of ethanol from mill to port terminal) [500 x .5 = 250] 250 0.22 Rail (50% of ethanol from sugar mill to port terminal) [500 x .5 = 250] 250 0.36 Ocean Tanker (Port Santos to Port of Los Angeles)* 8,420 2.03 Truck (Distribution from port) 150 1.21 Subtotal 9,070 3.82 Brazil demand met with corn ethanol from central Nebraska Rail (NE ethanol plant to port of Houston) 880 1.28 Ocean Tanker (Port of Houston to Port Santos)* 6,280 1.51 Truck (Distribution from port) 150 1.21 Subtotal 7,310 4.00 Grand Total Scenario B 16,380 7.82 *distances from http://www.portworld.com/map/ Now, we're not afraid of free and fair trade or a little competition. And this whole thing might not be such a big deal if Brazil's cane ethanol supply was increasing in balance with demand and if cane ethanol prices were closer to corn ethanol. But that's not the case. Brazil's domestic demand is outstripping an already short supply and the RFS2 and LCFS are just exacerbating pressure. So, while U.S. Federal and state fuels policies continue to roll out the red carpet for Brazilian imports based on subjective and unsettled lifecycle GHG analyses, the Brazilians discretely erect trade barriers to U.S. ethanol—even though they desperately need the product! This dichotomy was the subject of a letter RFA sent to the Brazil-U.S. Business Council earlier this week in response to the egregious claims in the council's Nov. 30 letter, referenced earlier. Check out the RFA letter here. And in the meantime, put on your shufflin' shoes!
发布时间:2011-12-12 Renewable Fuels AssociationAs the agreements in Durban do not propose additional action before 2020 the risk of exceeding 2°C remains very high. Action to implement the Durban Agreements will need to be quick to increase emission mitigation and hence have a chance at reaching this goal. Catching up on postponed action is costly and the technological and economic options required to do so are largely untested – or unknown. The Climate Action Tracker estimates that global mean warming would reach about 3.5°C by 2100 with the reduction proposals currently on the table.
发布时间:2011-12-11 Climate AnalyticsU.S. exports of denatured and undenatured (non-beverage) ethanol totaled 121.4 million gallons (mg) in October, just shy of the record of 127.4 mg established in June, according to government data released this morning. Brazil was the leading destination for U.S. exports, receiving a total of 50 mg. Canada and the EU continued to be other top export markets. Through the first 10 months of 2011, U.S. exports stood at 867.9 mg, more than double the 2010 export total. The U.S. is on pace to export more than 1 billion gallons in the calendar year. October exports included 84.5 mg of denatured product and 36.9 mg (a new monthly record) of undenatured ethanol. Canada was the top importer of denatured ethanol in October, taking in some 22.9 mg. Brazil followed closely with 22.4 mg, while the Netherlands (16.9 mg), United Kingdom (11.0 mg) and Finland (5.0 mg) rounded out the top five. Year-to-date, Canada has been the leading importer with 233.4 mg, followed by Brazil with 156.3 mg. As for undenatured ethanol, Brazil received the lion's share of exported product in October, bringing in 25.6 mg. The Philippines (4.3 mg), the Netherlands (2.4 mg), Nigeria (2.2 mg), and Mexico (2.0 mg) were other top destinations. On a year-to-date basis, Brazil has been the top importer of undenatured ethanol, receiving 93.7 mg. Meanwhile, the U.S. imported 13.1 mg of ethanol for fuel use from Brazil in October, presumably for compliance with the Renewable Fuel Standard's (RFS) advanced biofuel requirement and California's Low Carbon Fuel Standard (LCFS). Imports of sugarcane ethanol from Brazil have picked up significantly in recent months at the same time U.S. exports of corn ethanol to Brazil have grown. This "shuffling effect" is the subject of an extensive analysis and blog post the RFA will be releasing early next week.
发布时间:2011-12-09 Renewable Fuels Association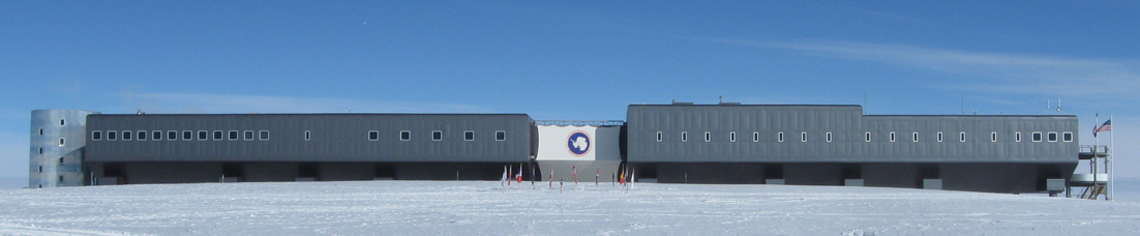
Special Report: U.S. South Pole Station Supporting Science Introduction Science Goals Navy Station 1956 NSF Station 1975 New NSF Station ☰ Photos Videos Education & Outreach Webcams ☰ Antarctica: the coldest, highest, driest and windiest of the continents, and the least hospitable to human life; but also, a unique scientific laboratory. NSF's Amundsen-Scott South Pole Station sits at the Earth's axis, atop a constantly shifting continental ice sheet several miles thick. A century ago, on Dec. 14, 1911, the first man-made structure was erected at the Earth's southernmost point: a forlorn pyramidal tent left by Norwegian Roald Amundsen, testifying to his achievement as the first person in history to reach the South Pole. Briton Robert F. Scott, his rival for that honor, found it roughly a month later. Scott and his party, who died returning from the Pole, were the last people to stand there for more than 40 years. In January of 2008, the National Science Foundation (NSF) dedicated a new research station at the geographic South Pole, the third successive U.S. station there since 1957. It bears the name of the two explorers. The dedication of the new Amundsen-Scott South Pole Station officially ushered in a new support system for enormously complex telescopes; seismic instruments; a massive detector for elusive subatomic particles called neutrinos; an atmospheric observatory; and other large-scale scientific experiments. It culminated a multi-year modernization project, authorized by the U.S. Congress in the late 1990's, to replace a domed station built in the 1970's. The complexity of the new station is in stark contrast to Amundsen's flag-decked tent. Unlike its two predecessors, which eventually were buried by drifting snow, the new station is aerodynamically designed and elevated above the surface of the Antarctic ice sheet to allow blowing snow to drift beneath it. It was designed and constructed so that it can be hydraulically raised to extend the station's useful life. It is capable of housing more than 100 people. Fuel and cargo storage, waste-management facilities, maintenance garages and power plant in the new station are located beneath the surface of the ice sheet. Housing, dining, recreation, administration, science and communications are located in the new building. As it has in its various incarnations for more than 50 years, Amundsen-Scott South Pole Station sits at the Earth's axis, atop a continental ice sheet more than a mile thick that moves 30 feet every year. Perhaps the world's most remote research facility, it lies at the heart of a continent the size of the U.S. and Mexico combined that is cut off from the rest of the globe by a circulating Southern Ocean current. The station is an amazing feat of engineering, dedicated to advancing the farthest frontiers of science. — by Peter West Image descriptions and credits Any opinions, findings, conclusions or recommendations presented in this material are only those of the presenter grantee/researcher, author, or agency employee; and do not necessarily reflect the views of the National Science Foundation.
发布时间:2011-12-09 National Science FoundationWashington – The Renewable Fuels Association (RFA) today wrote to the leadership of the U.S./Brazil Council and the U.S. Chamber of Commerce calling on them to denounce ethanol trade-distorting policies in Brazil. In late November, the groups urged Congress to allow the U.S. secondary tariff on imported ethanol to expire as it is scheduled. In addition to the inaccurate information about the U.S. and global ethanol market contained within, the letter also failed to address a number of policies in Brazil that are impeding U.S. ethanol exports to that nation. “Please know that while we share your desire for the removal of trade-distorting practices between the U.S. and Brazil, we are very concerned about the Council’s singular and biased focus on U.S. ethanol policy, and its failure to address more timely recent trade-distorting practices engaged in by Brazil,” wrote RFA President and CEO Bob Dinneen. Specifically, the RFA pointed out that the U.S. is now a major exporter of ethanol, sending nearly one billion of gallons to overseas markets including Brazil. The reason for this growth has been U.S.-produced ethanol’s average $0.58 discount to Brazilian ethanol since July 2009 and the poor ethanol productivity of Brazilian sugar mills in recent months. As such, the RFA expressed disappointment in the letter’s failure to address distorting trade policies in Brazil while inconsistently calling for fair trade. In its letter, the RFA pointed out two very specific actions taken by Brazil that limit U.S. access to that market. “First, Brazil has recently taken an action that has no other reasonable justification than to reduce the volume of U.S. exports of ethanol to Brazil. Recently, the Brazil government reduced the volume of ethanol that can be blended in fuel from 25% to 20%. As a result of this mandated reduction in blend volumes, U.S. exports of ethanol to Brazil are being dramatically reduced from levels that would have otherwise occurred had Brazil left the mandate at 25%,” the RFA pointed out. The result has been an increase in Brazilian imports of dirtier, more expensive petroleum-based fuels. “Second, while your letter to Congress is correct to state that Brazil’s 20% import tariff has been suspended, you fail to further explain that this suspension was only on a temporary basis. While Brazil’s Chamber of Foreign Trade (CAMEX) did indeed reduce its tariff in April of 2010, the temporary suspension is scheduled to expire one day after the U.S. tariff is set to expire,” the RFA pointed out. The RFA encourages these groups to urge the Brazilians to make their intentions known on this distorting practice. The U.S. secondary tariff on imported ethanol is set to expire at the end of this year. So, too, is the tax incentive for which the tariff was implemented to offset. The RFA is not advocating for the extension of either one. However, the RFA believes it would be smart trade policy for Congress to allow the U.S. Trade Representative the authority to negotiate away the U.S. secondary tariff in exchange for the removal of ethanol trade barriers in other nations, like those described above. In conclusion, the RFA wrote, “If the U.S. Chamber’s Brazil U.S Council is truly concerned about removing barriers to trade between the two countries, it would certainly be better served by addressing barriers that exist on both sides of the trade relationship. We would also expect the Council to issue the same missive to decision-makers in Brazil, and support the U.S. ethanol industry’s efforts to remove barriers to our exports. Trade with Brazil must be free and fair.”
发布时间:2011-12-08 Renewable Fuels AssociationDelaying any decisions on future climate action until 2015 or 2020 will bring a rapidly increasing risk in costs and threatens the likelihood of the world being able to keep global warming to below 2 degrees C, the Climate Action Tracker warned today in its Durban update. We are heading toward a global emissions pathway that will take warming to 3.5degC, and far from a cost-optimal pathway to keep warming below 2degC, according to the latest analysis from the Climate Action Tracker, a joint project of Climate Analytics, Ecofys and the Potsdam Institute for Climate Impact Research.
发布时间:2011-12-06 Climate Analytics