Carbon Peak and Carbon Neutralization Information Support Platform
碳达峰碳中和情报支持平台
在列表中检索

President Speech IAHE History IAHE Officials Board of Directors Advisory Board of Directors Emeritus Board Members IJHE Editorial Team IAHE Chapters and National Organizations IAHE Young Scientists Division IAHE Nuclear Hydrogen Division All IAHE Divisions IAHE Student Chapters Journal Books WHEC/WHTC Other Conferences IAHE Awards IAHE Fellows News About Hydrogen Energy Tokyo Hopes to Make Hydrogen Power the Star of the 2020 Olympics Governor of Tokyo has a vision that can change the world of energy! Tokyo plans to spend 40 billion yen about $330 million through 2020 to encourage the development of technologies based on hydrogen, a gas capable of producing energy without exhaust other than water when mixed with oxygen in a fuel cell. “The first Tokyo Olympics, 50 years ago, left a bullet-train system as a legacy. I want to leave a hydrogen society as a legacy for the next Tokyo Olympics,” Gov. Yoichi Masuzoe. To learn more about it, please refer to the following link. http://www.wsj.com/articles/tokyo-hopes-to-make-hydrogen-power-the-star-of-the-2020-olympics-1442174267 22.09.2015 Back Search Help? User E-Mail Password Become a Member Forgot your password?
发布时间:2012-12-30 international association for hydrogen energyU.S. exports of ethanol (denatured and undenatured, non-beverage) totaled 53.6 million gallons (mg) in October, up 8.6% from September and the highest since July. Canada was again the top destination for U.S. exports, followed by the United Kingdom and the Netherlands. Year-to-date exports stood at 643.3 mg, implying an annual total of 772 mg. Exports of denatured ethanol for fuel use tallied 30.3 mg, with nearly all (98%) of the product exported to Canada. The Netherlands was the only other major importer of U.S. denatured fuel ethanol in October, bringing in almost 402,000 gallons. Notably, denatured fuel ethanol shipments were at their lowest monthly level of the year in October. Meanwhile, exports of undenatured ethanol for fuel use jumped to 22.7 mg in October, nearly double the amount shipped in September. Top destinations for undenatured product were the United Kingdom (9.8 mg), the Netherlands (9.1 mg), Mexico (2.5 mg) and Ireland (1.2 mg). Exports of denatured and undenatured non-beverage ethanol for non-fuel use were just over 600,000 gallons. The U.S. was a net importer of ethanol again in October, bringing in 72.4 mg. Of the total, 56.2 mg came directly from Brazil and the remainder (16.2 mg) came by way of the CBI countries Jamaica and El Salvador. Interestingly, 5.4 mg of October imports were denatured, which was the first time this year the U.S. has imported sizeable shipments of denatured product. Year-to-date ethanol imports stood at nearly 390 million gallons, implying a calendar year total of 468 mg. Notably, the 2012 RFS2 advanced biofuel standard calls for 490 mg of "undifferentiated" advanced biofuel, and imported sugarcane ethanol can be used for compliance. October exports of distillers grains (DDGS) totaled 620,341 metric tons (mt), up 3.3% from September and the highest since July. China was again the leading market (140,277 mt), followed by Mexico (95,392 mt), South Korea (51,651 mt), Viet Nam (40,877 mt) and Canada (39,593 mt). Year-to-date exports stood at 6.37 million mt, implying an annualized total of 7.64 million mt.
发布时间:2012-12-12 Renewable Fuels AssociationToday's WASDE report was a non-event as far as the corn balance sheet. The only change was a slight decrease in the 2012/13 season-average price estimate, from $7.60/bu. to $7.40/bu. However, there were some important surprises on the global side. Global coarse grains production was increased 7.9 million metric tons, as China reported a much larger-than-expected corn crop (4% larger than the November estimate). Canadian corn output was also revised higher. The estimated size of Brazil's corn crop was unchanged, while Argentina saw a slight decrease. Overall, traders were looking for a minor decrease in global corn output and instead they got a 1.2% increase. Total global grain supplies were raised slightly to 2705.6 MMT, the second-largest on record. The U.S. ethanol industry is projected to use 78.9 MMT (net DDGS), meaning just 2.92% of the world grain supply is consumed for U.S. ethanol—the lowest rate in 5 years. Further, more grain will be available for non-ethanol use than any other time in history with the single exception of last year. In fact, grain available for non-ethanol use in 2012/13 will be 15% higher than 10 years ago in 2003/04. Meanwhile global population grew 9.8% during this period.
发布时间:2012-12-11 Renewable Fuels AssociationAustralia’s industrial sector could cut its energy use by 11 per cent without adversely affecting business activity, according to a new report released by Climateworks Australia today. Climateworks Interim Executive Director, Greg Garvin said the report identified potential energy savings across the industrial sector which could save businesses money and reduce greenhouse gas emissions. The report was commissioned by the Australian Government as part of design work on a possible national Energy Savings Initiative. Mr Garvin said extensive analysis of the industrial sector revealed greater energy efficiency opportunities than had previously been identified. “We looked at what energy efficiency opportunities were available in medium to large industrial businesses across the mining, manufacturing and transport sectors,” he said. “Our research revealed energy savings across these various industrial sectors which correspond to about 11 per cent of baseline energy use in 2010-11. “These energy savings could reduce energy costs by $3.2 billion (in 2010 real dollars) and cut emissions by 15 million tonnes. “Even more exciting is that most of these opportunities to reduce energy have a payback for business of less than two years.” Mr Garvin said the analysis revealed that 40 per cent of the opportunity was likely to be implemented under business as usual, leaving significant potential untapped. “Our research identified three categories of barriers to action including company capability, company motivation and project attractiveness,” he said. “Some barriers identified included capital constraints, information and skills gaps, decision processes and market structure and supply. “By working with companies and government it will be possible to alleviate some of the barriers to action and therefore unlock significant reductions in energy use in the industrial sector.”
发布时间:2012-12-11 ClimateWorks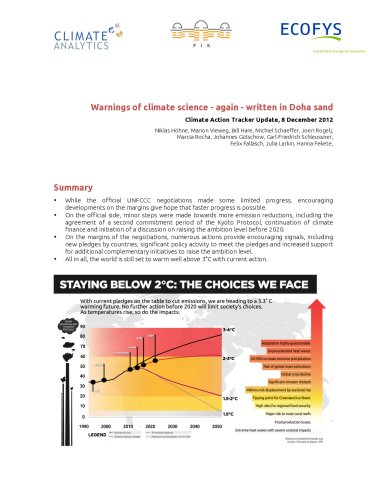
Warning of climate science - again - written in Doha sand Download Warnings of climate science - again - written in Doha sand, pdf Date Published 2012, December 08 Authors Niklas Höhne, Marion Vieweg, Bill Hare, Michiel Schaeffer, Joeri Rogelj, Marcia Rocha, Johannes Gütschow, Carl-‐Friedrich Schleussner, Felix Fallasch, Julia Larkin, Hanna Fekete, While the official UNFCCC negotiations made some limited progress, encouraging developments on the margins give hope that faster progress is possible. On the official side, minor steps were made towards more emission reductions, including the agreement of a second commitment period of the Kyoto Protocol, continuation of climate finance and initiation of a discussion on raising the ambition level before 2020. On the margins of the negotiations, numerous actions provide encouraging signals, including new pledges by countries, significant policy activity to meet the pledges and increased support for additional complementary initiatives to raise the ambition level. All in all, the world is still set to warm well above 3°C with current action.
发布时间:2012-12-08 Climate AnalyticsA new national index of business activity and its impact on reducing greenhouse gas emissions is being developed to track Australia’s progress towards a low carbon economy. The research being conducted by Climateworks Australia will enable government, businesses and the community to see the impact of actions taken to reduce emissions and to track Australia’s progress in achieving its 5 per cent emissions reduction target by 2020. Climateworks Interim Executive Director, Greg Garvin said the initial stage of the research focussed on the large industrial sector but would be expanded next year to provide an economy-wide perspective covering the power, buildings, agriculture and transport sectors. “It is critical to have a robust framework for monitoring low carbon activity and to understand how Australia is progressing towards a low carbon economy,” he said. “Existing reporting systems focus on the total number of emissions produced and the total level of energy use of individuals and businesses. However, there are no comprehensive statistics being collected and aggregated nationally to monitor the underlying activity that will determine progress towards our emissions reduction target. Our research means for the first time national data on low carbon activity across economic sectors will be brought together in a comprehensive and comparable way. Greg Garvin “For example, this might include data on the number of energy efficiency projects that are being implemented by industrial companies, the number of wind farms that are being built or proposed, or the land area that is being reforested. “We will use this data to produce the first whole-of-economy National Progress Report in reducing emissions including an in-depth analysis for large industrial energy efficiency opportunities by mid-2013.” Mr Garvin said a key part of the research would be identifying drivers and barriers to emissions reduction in the key industry sectors. “By mapping business activity in key sectors we can identify what actions are effective and where there are barriers to reducing carbon emissions,” he said. “This information will inform business and government about where they need to target their efforts and policy initiatives to overcome these problems.” Mr Garvin said the initial research showed many industrial companies were already taking significant action to reduce their energy use. “Over the last five years, energy efficiency activity in the large industrial sector has approximately tripled compared to historical levels,” he said. “Several companies have now changed their internal processes to ensure that energy efficiency is embedded into their decision making. “For example, Boral has implemented the LEAN manufacturing approach including for its energy management, which refocuses staff attention on the value of energy saving opportunities. “At Amcor, the energy efficiency team reports directly to the Chief Financial Officer which provides rigor to energy efficiency projects and raises their profile within the company.”
发布时间:2012-12-05 ClimateWorksFood prices have always been an emotional issue, and it's easy to understand why. After all, food is among the most basic of human needs, and groceries are permanently one of the top line items in the family budget. Only housing and transportation consume larger shares of household income. So, it's only natural that consumers react strongly to news about grocery prices or the cost of eating out. No one understands our society's emotional connection to food (and our sensitivity to food prices) better than the corporations that process, package, transport, advertise, and sell it. These large companies intimately understand that Americans have come to expect cheap food and frown on abnormal price increases. Big Food knows that they better have a good excuse or scapegoat at the ready every time they decide to increase food prices. This is exactly why the food lobby has made grocery prices a central theme in its relentless campaign against ethanol and the Renewable Fuel Standard (RFS). In attempting to prey upon the emotions and sensitivities of American consumers, the food groups use an arsenal of scary words (like "skyrocketing," "surging," "spiking") to characterize food price trends. Then they quickly point to increased ethanol production as the scapegoat for supposed higher food prices. Of course, these corporations aren't necessarily concerned about the economic welfare of consumers (on the contrary, increased food prices means increased revenues for them). Rather, the true motives behind their attacks on the RFS and their claims of "out of control" food prices are to protect their own profits and send farm commodity prices back below the cost of production. The absurdity of Big Food's alarmist rhetoric becomes quickly apparent when one examines the actual data and trends regarding food prices. The data show that food prices ARE NOT increasing abnormally and the average American household spends less of its income on food today than 10 years ago (i.e., before the "ethanol era"). So, the next time you hear food processors and grocery manufacturers warning of "sky-high" food prices and the role of the RFS, call "baloney" and remember these key facts: First of all, asking whether food prices are "higher" today than in the past is the wrong question. Of course food prices are higher, as are prices for every other product or service Americans purchase. Like it or not, inflation is a fact of life. Rather, the right questions to ask are: "How much higher are food prices? Are food prices increasing abnormally? How do food price increases compare to price increases for other goods and services?" Food inflation rates have averaged 2.95% per year since 2005, the year Congress first adopted the RFS. That compares to average annual food inflation of 3.47% in the 25-year period (1980-2004) leading up to adoption of the RFS. USDA expects annual food inflation for 2012 to be approximately 3.0%, right in line with historical norms and below the 2011 rate. The average monthly increase in food prices since the RFS was expanded in December 2007 is 0.23%. That compares to average monthly food price increases of 0.27% over the last 15 years. Consumer prices for all items have increased by a comparable monthly average of 0.24% over that span. Meanwhile, energy price increases have averaged 0.78% per month over the past 15 years—three times the rate of food inflation! Inflation rates for food and all items have been remarkably stable and consistent over the past 15 years (with the exception of a brief period during the "commodities bubble" of 2008). Growth in ethanol production and adoption of the RFS in 2005 hasn't altered the stability or rate of change in the indexes for food and all items. By comparison, the energy price index has been extremely volatile over the past 15 years and has seen rapid acceleration. Food prices have increased just 1.7% over the past 12 months (October 2011 to October 2012). That is lower than the general rate of inflation for all items over the past year (2.2%), and less than half of the inflation rate for energy (4.0%). Prices for most meat and dairy products are lower today than they were a year ago, or at least near the same levels. Curiously, Big Food wasn't complaining about "spiking food prices" or the impacts of the RFS last fall. The annual food inflation rate in 2010 was 0.8%, the lowest increase in almost 50 years. Meanwhile, the ethanol industry in 2010 produced 13.2 billion gallons of ethanol, which was a new record. Since 1980, annual food inflation rates have continued to trend downward, while ethanol production has grown exponentially. Americans continue to spend less than 10% of their income on food, down from more than 20% in the late 1940s and early 1950s. Today, less than 6% of household income is spent on food consumed at home (i.e., groceries), while 4% is spent on meals away from home. Research published in the journal Food Policy in 2012 shows that a tremendous amount of food is wasted in America each day. According to the authors, the amount of food wasted by the average American is valued at $1.07 per day. They concluded, "Food loss represents a significant share of household food expenditures: our estimates suggest that the annual value of food loss is almost 10% of the average amount spent on food per consumer in 2008 and over 1% of the average disposable income."
发布时间:2012-12-03 Renewable Fuels AssociationA Decree of the Supreme Court of the United States, entered June 7, 1954, established the position of Delaware River Master within the U.S. Geological Survey. In addition, the Decree authorizes diversion of water from the Delaware River Basin and requires compensating releases from certain reservoirs, owned by New York City, to be made under the supervision and direction of the River Master. The Decree stipulates that the River Master will furnish reports to the Court, not less frequently than annually. This report is the 60th annual report of the River Master of the Delaware River. It covers the 2013 River Master report year, the period from December 1, 2012 to November 30, 2013. During the report year, precipitation in the upper Delaware River Basin was 44.50 inches or 100 percent of the long-term average. Combined storage in the Pepacton, Cannonsville, and Neversink Reservoirs remained high until October 2013 when it decreased below 80 percent combined capacity. The lowest combined storage of the report year was 70.2 percent of combined capacity on November 26, 2013. Delaware River Master operations during the year were conducted as stipulated by the Decree and the Flexible Flow Management Program. Diversions from the Delaware River Basin by New York City and New Jersey were in full compliance with the Decree. Reservoir releases were made as directed by the River Master at rates designed to meet the Montague flow objective for the Delaware River at the Montague, New Jersey streamgage on 71 days during the report year. Interim Excess Release Quantity and conservation releases, designed to relieve thermal stress and protect the fishery and aquatic habitat in the tailwaters of the reservoirs, were also made during the report year. An agreement was signed on July 16, 2013 to temporarily increase releases to provide thermal protection below Cannonsville Reservoir. The quality of water in the Delaware River estuary between streamgages at Trenton, New Jersey, and Reedy Island Jetty, Delaware, was monitored at several locations. Data on water temperature, specific conductance, dissolved oxygen, and pH were collected continuously by electronic instruments at four sites.
发布时间:2012-12-01 USGSThere is a vast surplus of units in Kyoto’s cap-and-trade system. If no solution for the carry-over of this surplus from commtment period to commitment period is found, countries that have put forward a target for the second commitment period (CP2) may be under no pressuure to deviate from business-as-usual (BAU) emissions until 2026.
发布时间:2012-11-30 Climate AnalyticsLimiting global warming below 2°C – or even to below 1.5°C remains technically and economically feasible, but only with political ambition backed by rapid action starting now, the Climate Action Tracker said today.
发布时间:2012-11-30 Climate Analytics