NATIONAL INDUSTRY ALLIANCE FOR MARINE DRUGS AND BIOPRODUCTS
Breast cancer remains the most diagnosed cancer among women worldwide, accounting for 24.5% of all new cases and 15.5% of cancer-related deaths in women. Notably, China reports the highest incidence, comprising approximately 18.4% of global breast cancer cases [1]. Compared to other subtypes, TNBC predominantly affects younger women and is characterized by higher malignancy and mortality rates [2]. Currently, chemotherapeutic agents such as taxanes and anthracyclines remain the mainstay of TNBC treatment; however, the development of acquired drug resistance severely limits their clinical efficacy [3]. Consequently, novel therapeutic strategies are urgently needed. In recent years, targeted approaches focusing on PARP, CDK4/6, PI3K, and AKT inhibitors have emerged as prominent areas of research. Despite these advances, their efficacy in TNBC remains suboptimal, underscoring the importance of identifying new molecular targets for innovative drug discovery in this subtype [4], [5], [6].
Emerging evidence indicates that the pathogenesis and progression of TNBC are closely associated with the aberrant activation of PIM1 kinase [7], [8], [9]. PIM1 is a constitutively active serine/threonine kinase that, while not essential for normal cellular function, plays a pivotal role in the development and unfavorable prognosis of several malignancies, including TNBC [7], [8], hepatocellular carcinoma [10], prostate cancer [11], and colorectal cancer [12]. In TNBC, PIM1 gene amplification and overexpression significantly promote cell proliferation by cooperating with c-MYC to inhibit mitochondria-mediated apoptosis, as evidenced by reduced proliferation and bcl-2 expression upon PIM1 knockdown in most tested cell lines [7]. PIM1 kinase inhibitors such as SGI-1776 (Fig. 1) has demonstrated the ability to suppress transcriptional level of MYC, restore the function of cell cycle inhibitor p27, and inhibit tumor growth in both patient-derived xenograft (PDX) models and MYC-driven transgenic mouse models of breast cancer [8]. These findings collectively establish PIM1 as a critical factor promoting TNBC tumorigenesis through MYC signaling pathways.
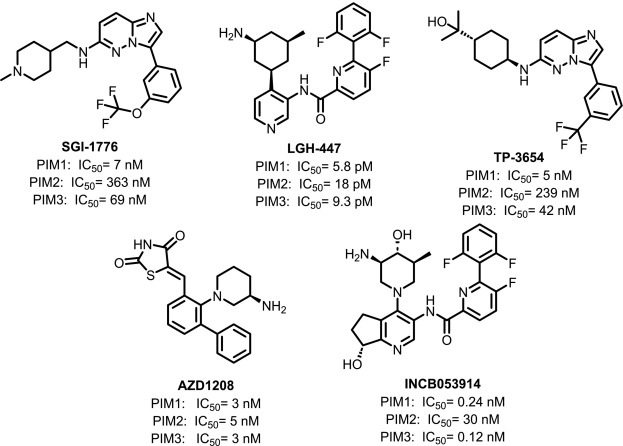
Fig. 1. Representative PIM1 inhibitors from the literature.
Currently, PIM1 has emerged as a promising kinase drug target for several refractory hematological malignancies and solid tumors. Despite extensive efforts, no PIM1 inhibitor has yet been approved for clinical use, primarily due to limitations in efficacy and concerns regarding adverse effects [13], [14]. Several PIM1 kinase inhibitors (Fig. 1), such as LGH-447 (phase I), TP-3654 (phase II), AZD1208 (phase I) and INCB053914 (phase II), have entered clinical trials. Although studies have provided encouraging evidence for the efficacy and relative safety of PIM kinase inhibitors, important challenges remain [14]. Notably, the first-generation PIM inhibitor SGI-1776 was withdrawn from early clinical development due to cardiac toxicity. Hematological toxicities, particularly thrombocytopenia and anemia, have also posed major barriers [15]. It has been reported that administration at higher doses can lead to fatal outcomes (NCT01456689), and poor tolerability has led to the early termination of some trials (NCT01456689, NCT02144038). Therefore, there is an urgent need to identify and develop novel lead compounds as PIM kinase inhibitors, with a specific focus on improving efficacy and minimizing side effects.
Preclinical studies indicate that the antitumor efficacy of PIM1 inhibitors is significantly enhanced when combined with chemotherapeutic agents or other targeted therapies; however, monotherapy targeting PIM1 alone has shown limited clinical benefit [13]. This limitation is generally attributed to functional redundancy between PIM1 kinase and the PI3K/AKT/mTOR signaling pathway, whereby PIM1 inhibition frequently elicits compensatory activation of the PI3K/AKT/mTOR cascade [9]. This functional interplay indicates that simultaneous inhibition of PIM1 and PI3K/AKT/mTOR-related kinases can synergistically enhance antitumor activity. Accordingly, developing multi-kinase inhibitors that retain potent PIM1 activity while modulating selected kinases connected to PI3K/AKT/mTOR signaling may represent a pragmatic strategy for TNBC lead discovery.
In this study, virtual screening was employed in conjunction with biological activity assays to identify a series of indolocarbazole derivatives with PIM1 inhibitory activity. Indolocarbazoles represent a prominent class of marine-derived natural products, with staurosporine serving as a prototypical compound (Fig. 2). To date, over 150 natural indolocarbazoles, predominantly in glycosidic or glycosidic conjugate forms, have been isolated from bacteria and marine invertebrates. Numerous natural indolocarbazoles were purified from diverse marine actinomycetes [16], [17], [18], [19], [20]. These molecules are structurally characterized as ATP-competitive protein kinase inhibitors with broad inhibitory activity against kinases such as FLT3, TRKA, PKCδ, and PKCε [21], [22], [23], [24]. Notably, several indolocarbazole derivatives, such as midostaurin, lestaurtinib, enzastaurin, and edotecarin (Fig. 2), have been approved or are currently in clinical development, highlighting the drug-like potential and value of the indolocarbazole scaffold. The substituent pattern on indolocarbazole cores substantially influences target selectivity and biological activity. Structural modifications, particularly glycosylation, ring closure between the sugar and aglycone moieties, and introduction of various substituents (e.g., hydroxyl groups), have been shown to markedly affect both kinase inhibition and selectivity profiles [20], [25]. For example, the clinical antitumor agents lestaurtinib and midostaurin primarily target FLT3 kinase [26], [27]; the anti-Parkinson's disease compound CEP1347 (Fig. 2) targets MLK3 kinase, while edotecarin acts primarily as a topoisomerase I inhibitor [28], [29]. These findings highlight the structural versatility of the indolocarbazole framework in modulating diverse signaling pathways.
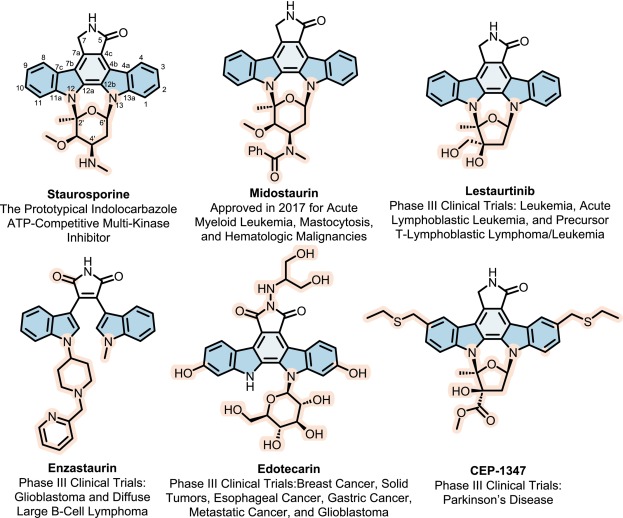
Fig. 2. Reported indolocarbazole derivatives.
Nevertheless, most indolocarbazole-based inhibitors exhibit strong inhibitory activity toward PKC isoforms, and excessive PKC inhibition has been implicated in off-target toxicity and poor tolerability in preclinical and clinical studies [20], [30]. To overcome these challenges, we sought to optimize indolocarbazole derivatives to reduce undesired PKC inhibition while retaining potent PIM1 activity and a controlled multi-kinase profile relevant to TNBC survival signaling.
Building on our prior isolation and synthesis of novel indolocarbazole analogs, we first used molecular dynamics (MD) simulations to map key interactions between the hit compounds and the PIM1 active site. Then integrated a discrete variational auto-encoder with an improved NSGA-III genetic algorithm to perform multi-objective, AI-assisted molecular evolution aimed at maximizing inhibitory potency against PIM1, retaining activity toward kinases within the PI3K/AKT/mTOR pathway, and minimizing off-target inhibition of PKCδ/ε/η to improve safety. This workflow furnished P19, a PIM1-potent indolocarbazole derivative that showed improved PKC-sparing properties relative to N6 while retaining a broader multi-kinase activity profile.
A virtual screening campaign was conducted against the PIM1 kinase (PDB: 1XWS) using the Schrödinger Glide flexible docking protocol, applying it to a library of 1056 compounds previously isolated, synthesized, or derived by our research group (Fig. 3A). Following redocking and manual inspection of the docking poses, 51 indolocarbazole compounds were selected for further investigation. Of these, 18 compounds (N1-N18) originated from the secondary metabolites of marine-derived Streptomyces species, while 33 compounds (N19-N51) were obtained from synthetic derivatives. All 51 compounds were subsequently evaluated for their inhibitory activity against PIM1 kinase using the HTRF®KinEASE™ kinase assay kit, with TP-3654 (IC50 = 31.1 nM) serving as a positive control (Table 1). Remarkably, 16 of these compounds, including N6 (IC50 = 5.4 nM), exhibited potent PIM1 kinase inhibitory activity, with seven compounds (N4, N6, N12, N26, N46, N48, and N50) demonstrated activity comparable to or exceeding that of TP-3654. Based on structure-activity relationship (SAR) analysis and comparison with MD simulation results, N6 was selected as the lead compound for further structural optimization.
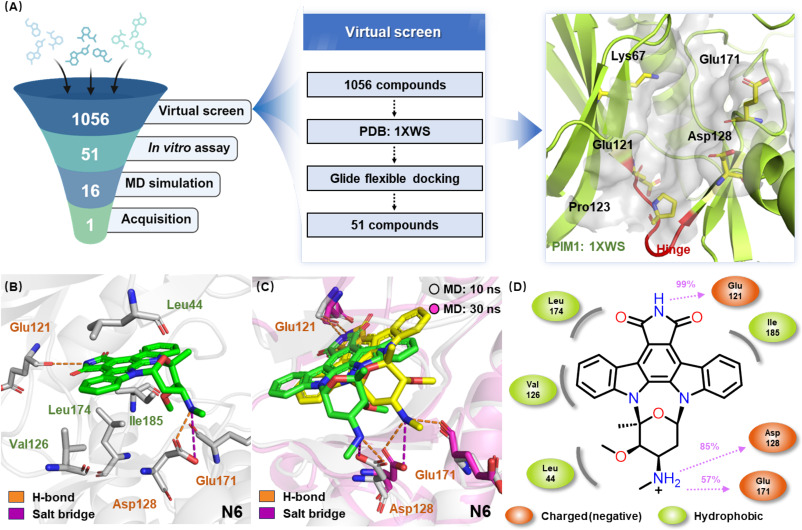
Fig. 3. (A) Identification of the lead compound by virtual screening and in vitro kinase assays. (B) Induced fit docking model of N6 in complex with PIM1 (PDB: 1XWS). (C) Representative binding conformations of N6 with PIM1 observed at 10 ns (green) and 30 ns (yellow) during the MD simulations. (D) A schematic of detailed ligand atom interactions with the protein residues. Interactions that occur more than 30.0% of the simulation time. (For interpretation of the references to color in this figure legend, the reader is referred to the web version of this article.)
Table 1. Structures and PIM1 inhibitory activities of compounds N1-N51.a
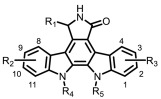
| No. | R1 | R2 | R3 | R4R5 | IC50 | No. | R1 | R2 | R3 | R4R5 | IC50 |
|---|---|---|---|---|---|---|---|---|---|---|---|
| N1 | OCH3 | H | 3-OH | H, H | >1000 | N27 | H | 9-OH | 3-OH | H, H | >1000 |
| N2 | H | 9-OH | H | H, H | >1000 | N28 | H | 9-OCH3 | 3-OCH3 | H, H | >1000 |
| N3 | OH | H | H | H, H | >1000 | N29 | C=O | 9-OCH3 | 3-OH | H, H | 534.8 |
| N4 | H | H | H |

|
13.5 | N30 | H | 9-OH | 3-OCH3 | H, H | >1000 |
| N5 | OH | H | H |

|
>1000 | N31 | H | 9-OCH3 | 3-OH | H, H | >1000 |
| N6 | C=O | H | H |

|
5.4 | N32 | C=O | H | 3-CH3 | H, H | >1000 |
| N7 | H | H | H |

|
>1000 | N33 | H | 9-CH3 | H | H, H | >1000 |
| N8 | H | H | H |

|
703.0 | N34 | H | H | 3-CH3 | H, H | >1000 |
| N9 | H | H | 3-OH |

|
>1000 | N35 | C=O | H | 3-t-Bu | H, H | >1000 |
| N10 | H | H | 3-OH |

|
>1000 | N36 | H | 9-t-Bu | H | H, H | >1000 |
| N11 | H | H | 3-OH |

|
149.1 | N37 | H | H | 3-t-Bu | H, H | >1000 |
| N12 | H | H | H |

|
15.6 | N38 | C=O | H | 1-OCH3 | H, H | >1000 |
| N13 | H | H | H |

|
>1000 | N39 | C=O | H | 1-OH | H, H | >1000 |
| N14 | H | H | H |

|
>1000 | N40 | H | 11-OH | H | H, H | >1000 |
| N15 | H | 9-OH | H |

|
>1000 | N41 | H | H | 1-OH | H, H | >1000 |
| N16 | H | H | H |

|
>1000 | N42 | C=O | H | 4-OCH3 | H, H | 166.1 |
| N17 | OCH3 | H | H |

|
>1000 | N43 | C=O | H | 2-OH | H, H | 319.8 |
| N18 b | C=O | H | H |

|
670.9 | N44 | H | 10-OH | H | H, H | >1000 |
| N20 | C=O | H | 3-OCH3 | H, H | >1000 | N45 | H | H | 2-OH | H, H | >1000 |
| N21 | C=O | H | 3-OH | H, H | 86.2 | N46 | C=O | H | H |

|
31.2 |
| N22 | H | H | 3-OH | H, H | >1000 | N47 | H | H | H |

|
>1000 |
| N23 | H | 9-OCH3 | H | H, H | >1000 | N48 | C=O | H | H |

|
3.1 |
| N24 | H | H | 3-OCH3 | H, H | >1000 | N49 | H | H | H |

|
164.6 |
| N25 | C=O | 9-OCH3 | 3-OCH3 | H, H | >1000 | N50 | C=O | H | H |

|
25.4 |
| N26 | C=O | 9-OH | 3-OH | H, H | 13.1 | N51 | H | H | H |

|
305.7 |
TP-3654 was used as a positive control (IC50 = 31.1 nM).
Structure of N19 is shown as follows

. N19 exhibited an IC50 > 1000 nM.
To identify the key amino acid residues that contribute to the PIM1 kinase inhibitory activity of indolocarbazole compounds, we first performed induced fit docking (IFD) analysis using the Schrödinger software suite. As a representative example, we selected 7‑carbonyl staurosporine N6. Analysis focusing on the ATP-binding pocket of PIM1 kinase revealed that N6 forms a crucial hydrogen bond between the imide NH and Glu121 (Fig. 3B). In addition, the terminal secondary amine of the sugar ring forms both a hydrogen bond and a salt bridge with Asp128. MD simulations further highlighted the dynamic interactions between N6 and PIM1, showing that for 57% of the simulation time, the secondary amine of N6 also establishes a hydrogen bond with Glu171 (Fig. 3C, D). These interactions are consistent with the reported PIM1-staurosporine co-crystal structure, confirming that our MD simulations reliably capture the known binding mode [31]. This validated approach can thus predict binding conformations of related indolocarbazoles and guide the design of analogs that retain PIM1 potency while reducing PKC isoform inhibition.
Following SAR studies highlighted the imide functionality, and specifically the C-7 carbonyl group, as a decisive feature for potency. Among the 18 natural indolocarbazole derivatives, those unsubstituted at C-7 or bearing hydroxy or methoxy groups displayed weaker kinase inhibition compared to compounds with a carbonyl group at this position (e.g., N4-N6, N16-N18). Notably, the addition of a C-7 carbonyl to staurosporine (N46-N51) afforded a 10-fold increase in activity. Similar trends were observed in aglycones (e.g., N1, N21-N22, N26-N27, N29-N31, N43-N45), consistently indicating that C-7 carbonyl substitution enhances potency.
MD simulations corroborated these SAR findings (Fig. 4). The electron-withdrawing C-7 carbonyl group increases the acidity of the adjacent NH, enabling a more stable hydrogen bond with Glu121 and optimal inhibitory activity, exemplified by N6 (IC50 = 5.4 nM). In contrast, N4, lacking a strong electron-withdrawing group at C-7, forms comparatively weaker hydrogen bonds and exhibits lower activity (IC50 = 13.5 nM). Although the hydroxyl group in N5 can increase hydrogen bonding strength through inductive effects, steric hindrance from the Leu120 side chain, as well as from the hydroxyl itself, dramatically decreases its activity (IC50 > 1000 nM). These results establish the C-7 carbonyl as a generalizable structural element that strengthens binding stability and inhibitory potency against PIM1 kinase.
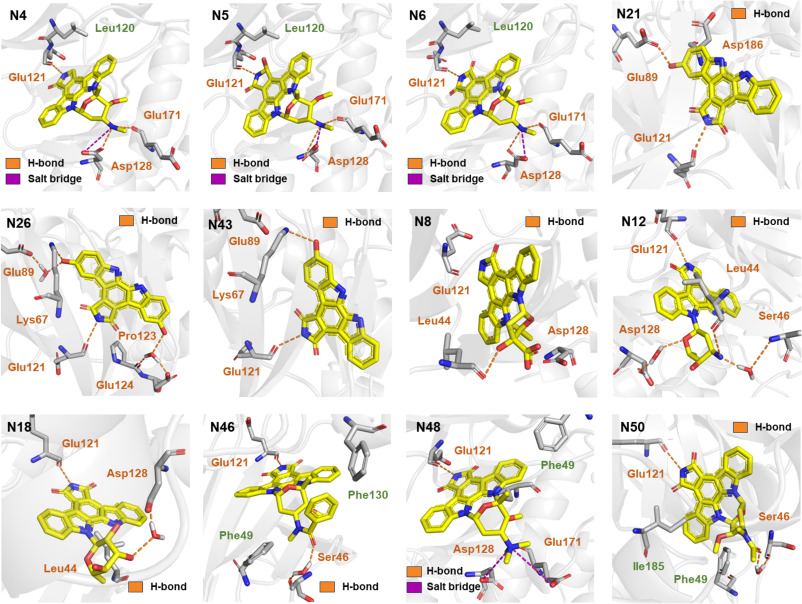
Fig. 4. Representative binding conformations of selected compounds with PIM1, as predicted by MD simulations.
Hydroxy substitution at C-3 and C-9 also proved favorable. Synthesized derivatives with nonpolar substituents (methyl, tert-butyl) on the core displayed poor inhibition (e.g., N32-N37), whereas polar substituents imparted activity dependent on both type and position. For aglycones, dual hydroxy substitution at C-3 and C-9 yielded markedly improved potency (IC50 < 100 nM) and was superior to single C-3 substitution (e.g., N21, N26). In contrast, hydroxy at C-2 diminished activity, and C-1 substitution conferred poor inhibition (e.g., N39, N43). Methoxy substitution generally impaired potency (e.g., N25, N26, N29), with C-4 methoxy retaining comparatively higher activity (e.g., N20, N38, N42). MD simulations provided mechanistic insights (Fig. 4). The core NH of N21 interacted with Glu121, while the 3-OH formed an additional hydrogen bond with Glu89, supporting significant inhibition (IC50 = 86.2 nM). Dual hydroxy groups of N26 further enhanced activity (IC50 = 13.1 nM) with the 3-OH forming a water-bridged interaction with Glu89 and a hydrogen bond with Lys67, while the 9-OH engaged in water-bridged interactions with Pro123 and Glu124. Conversely, in N43 (IC50 = 319.8 nM), the 2-OH formed a hydrogen bond with Lys67, but these data suggest that hydroxy groups engaging Glu89 are more beneficial than those interacting with Lys67.
Finally, glycosylation patterns significantly influenced activity. Derivatives with C-2′, C-6′ disaccharide linkages consistently outperformed both non-glycosylated compounds and those bearing monoglycosides or C-2′, C-4′ disaccharide linkages (e.g., N4, N6, N9-N14, N16, N18, N21, N26). MD simulations indicated that N8 primarily interacted with Leu44, with reduced hydrogen bond occupancy at Glu121 explaining its low potency (IC50 = 703.0 nM). The glycosyl moiety of N12 engaged Asp128, Leu44, and Ser46, corresponding to enhanced activity (IC50 = 15.6 nM). N18 interacts primarily with Glu121 and Leu44, with the latter occurring mainly through water-bridged interactions, resulting in reduced affinity (IC50 = 670.9 nM).
C-4′ modification on 7‑carbonyl staurosporine preserves potency when core pharmacophore interactions are maintained. Methylation, acylation, or benzoylation delivered potent inhibitors (N46, N48, N50) with IC50 values comparable to N6. N48 was most active (IC50 = 3.1 nM), outperforming TP-3654. Mechanistically, N48 retains strong salt bridges with Asp128 and Glu171. In N46, the benzamide diminishes Asp128/Glu171 occupancy but compensates via a water-bridged interaction with Ser46 and hydrophobic contacts with Phe49/Phe130, yielding only a slight potency drop. N50 shows a similar shift toward Ser46 with modest steric bulk and intermediate potency. All analogs maintain the hallmark imide-NH hydrogen bond to Glu121.
Collectively, these data establish Glu121 engagement as the principal determinant of affinity, with glycosylated derivatives more frequently forming auxiliary contacts with Asp128/Glu171 or Ser46, thereby enhancing inhibition. N6 is a strong lead, sustaining Glu121/Asp128/Glu171 interactions. Nevertheless, it should be noted that N6 is also a potent pan-PKC inhibitor (IC50: PKCδ = 1.4 nM, PKCε = 2.3 nM, PKCη = 2.1 nM) and exhibits considerable cytotoxicity toward normal cells (IC50: MCF-10A = 0.7 nM), raising concerns regarding its therapeutic window.
Research on PKC inhibitors has spanned over four decades, with indolocarbazole compounds representing one of the major classes in this field [20]. However, their clinical performance has generally been unsatisfactory; most PKC-targeted inhibitors have failed to achieve regulatory approval and, in some cases, have even worsened patient outcomes [32]. Clinical trial data indicate that combining the PKC inhibitor enzastaurin with chemotherapy often leads to poorer prognosis compared to chemotherapy alone [33], [34]. Moreover, many PKC inhibitors do not act exclusively on PKC. For instance, midostaurin, originally developed as a PKC inhibitor from the indolocarbazole class, exerts its therapeutic effect in acute myeloid leukemia primarily through FLT3 inhibition, rather than PKC alone. The expression and function of PKC in cancer cells are highly dependent on tumor type and tissue of origin, and indolocarbazole-based inhibitors typically lack sufficient selectivity among PKC isoforms, leading to non-specific inhibition and potential off-target effects. These challenges underscore the need for indolocarbazole-based kinase inhibitors with better-defined activity profiles and reduced liabilities against PKC isoforms. Accordingly, our subsequent structural modifications focused on retaining potent PIM1 inhibition while reducing PKCδ/ε/η cross-reactivity relative to N6, with the goal of advancing lead compounds with improved PKC-sparing properties for further TNBC-oriented optimization.
Sequence alignment of the kinase domains of PIM1 and the PKC isoforms PKCδ, PKCε, and PKCη revealed a high degree of conservation within their catalytic cores (Fig. 5A). Notably, the key amino acid residues that mediate the binding of N6 to PIM1, namely Glu121, Asp128, and Asp186, are well conserved in PKCδ, PKCε, and PKCη (corresponding to Glu434, Asp440, and Asp497, respectively). Structural superposition, using PKCη as a representative, further reveals highly similar folding and backbone conformations around the ATP-binding pocket (Fig. 5B). The spatial arrangement of Glu121, Asp128, and Asp186 is nearly identical across PIM1 and PKCη, consistent with a conserved substrate-recognition and inhibitor-binding paradigm. Notably, PIM1 Glu171 and Ser 46 is replaced by Asp483 and Lys366 in PKCδ/PKCε/PKCη. Although these residues differ in intrinsic physicochemical properties, their side-chain orientations and local microenvironments appear to support analogous ligand-directed hydrogen-bonding geometries, suggesting a broadly conserved inhibitor-binding mode. Collectively, these data support a strong mechanistic similarity between PIM1 and PKCδ/PKCε/PKCη in inhibitor engagement, underscoring the need for fine-grained selectivity determinants in N6 optimization.
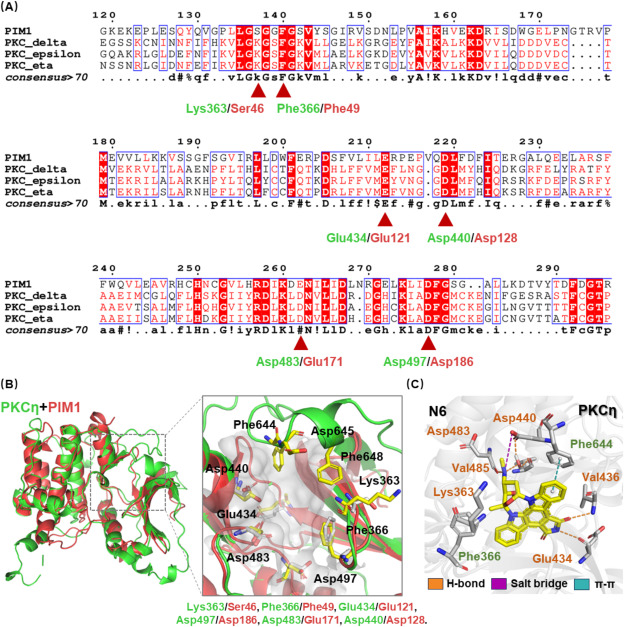
Fig. 5. (A) Partial sequence alignment of PIM1 (NP_001230115.1) and different PKC isoforms: PKCδ (NP_001341608.1), PKCε (NP_005391.1), and PKCη (NP_006246.2). (B) Structural superposition of the crystal structures of PKCη (PDB: 3TXO) and PIM1 (PDB: 1XWS). (C) Representative binding conformations of N6 with PKCη, as predicted by MD simulations.
Despite the overall structural similarity, significant differences exist in the local architecture of the ATP-binding pocket. For example, the ATP-binding pocket of PKCη is narrower than that of PIM1, mainly due to the presence of an α-helical segment formed by Phe644 and Asp645, which is absent in PIM1. This α-helix restricts the available space in the PKCη binding site. Based on these structural disparities, rational design of PIM1-potent analogs with reduced PKC inhibition could involve incorporating larger or more spatially demanding moieties into the inhibitor scaffold to exploit the more open ATP-binding pocket of PIM1, thereby enhancing affinity for PIM1 while sterically disfavoring binding to the more restricted PKCδ/PKCε/PKCη pockets, thereby improving relative PKC sparing.
Further MD simulations confirmed that the binding mode of N6 with PKCη closely resembles its interaction with PIM1 (Fig. 5C). Within the PKCη binding pocket, N6 forms a stable hydrogen bond with Glu434, a terminal secondary amine hydrogen bond with Asp483, and engages in both salt-bridge and water-mediated interactions with Asp440. Compared to its binding in PIM1, N6 also forms an additional carbonyl hydrogen bond with Val436, a water-bridged interaction with Val485, and exhibits π-π stacking with Phe644 in PKCη. Structural analysis revealed close spatial proximity between the secondary amine group of N6 and Phe644. Structural analysis places the secondary amine at the C-4′ position of N6 in close proximity to Phe644. Together with SAR data showing that amide derivatization at this position minimally affects PIM1 inhibition, these observations define a tractable vector for optimization. We therefore posited that installing bulkier substituents or tailored functional groups at the secondary amine could induce steric clash within the spatially constrained region adjacent to the Phe644 α-helix in PKCη, thereby preserving PIM1 engagement while attenuating activity against PKCδ/PKCε/PKCη.
To address the dual challenge of preserving scaffold integrity while achieving structural diversity during lead optimization, our group developed an advanced Deep Genetic Molecule Modification (DGMM) framework [35]. This approach synergistically integrates a variational autoencoder (VAE) deep learning model with a multi-objective genetic algorithm to enable efficient and sophisticated molecular evolution. We implemented an enhanced NSGA-III genetic algorithm protocol with N6 derivatives comprising the initial population. Through iterative cycles of algorithmically-driven mutation and crossover operations, structurally diverse analogs were generated. To optimize exploration of chemical space, Bayesian optimization was incorporated to guide the evolutionary trajectory and adaptively fine-tune selection parameters.
The primary objectives were to maintain or improve PIM1 potency, reduce PKCδ/ε/η inhibition relative to N6, and preserve acceptable drug-likeness and synthetic accessibility. Utilizing the DGMM framework, 25 epochs were performed (Fig. 6A, Table S1). Docking score analysis of the evolved molecules demonstrated continuous improvement across iterations (Fig. 6B). Integrating docking metrics, quantitative estimates of drug-likeness (QED), and synthetic accessibility (SA), the resulting molecules were stratified into three ranks (Fig. 6C, D). Subsequently, through manual inspection of the binding conformations and synthetic feasibility of the rank 0 candidates, a total of 19 compounds were selected for synthesis (Table 2).
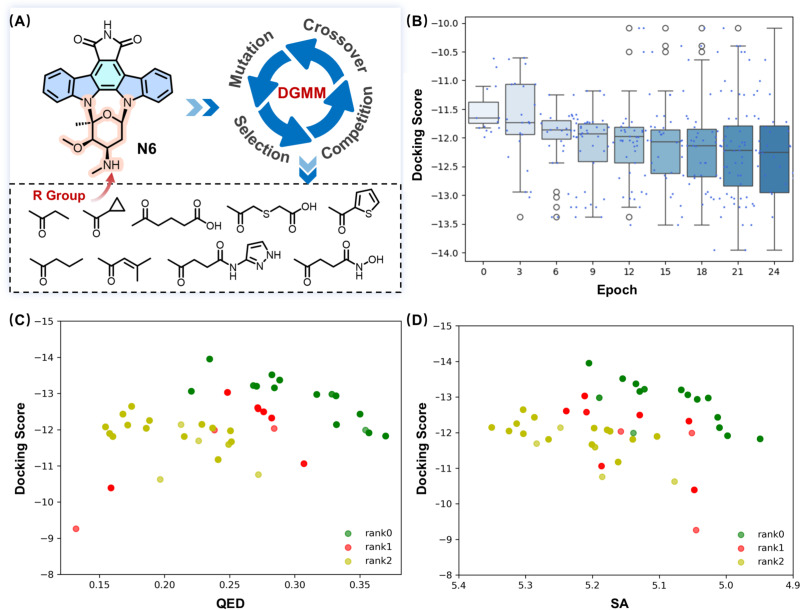
Fig. 6. (A) Schematic illustration of the DGMM-driven molecular optimization workflow and representative R groups in the final epoch. (B) Distribution of docking scores for molecules generated in different evolutionary epochs. (C) Correlation between docking scores and QED values of generated molecules. (D) Correlation between docking scores and SA values of the generated molecules. Data points are color-coded according to molecular ranking (rank 0, rank 1, rank 2), with rank 0 representing the top-performing candidates.
Table 2. Structures and PIM1 inhibitory activities of compounds P1-P19.
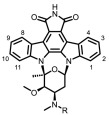
| No. | R | PIM1 IC50 (nM) | No. | R | PIM1 IC50 (nM) |
|---|---|---|---|---|---|
| P1 |

|
41.0 | P11 |

|
65.9 |
| P2 |

|
83.0 | P12 |

|
53.8 |
| P3 |

|
>1000 | P13 |

|
855.3 |
| P4 |

|
>1000 | P14 |

|
52.4 |
| P5 |

|
>1000 | P15 |

|
>1000 |
| P6 |

|
>1000 | P16 |

|
81.4 |
| P7 |

|
444.7 | P17 |

|
>1000 |
| P8 |

|
42.9 | P18 |

|
32.4 |
| P9 |

|
39.1 | P19 |

|
3.6 |
| P10 |

|
61.1 | TP-3654 | / | 31.1 |
Guided by artificial intelligence-driven structural optimization results, a semi-synthetic strategy was adopted to prepare derivatives of 7‑carbonyl staurosporine N6 (Scheme 1). The synthesis pathway initially required substantial quantities of staurosporine N4, which was subsequently oxidized to afford the desired N6. The marine actinomycete Streptomyces sp. SS-13G, previously isolated by our laboratory from intertidal sediments in the Shengsi Archipelago (Zhoushan, Zhejiang Province, China) was selected for its exceptional staurosporine production capacity. Large-scale fermentation was carried out over 10 days using Gause's synthetic No. 1 medium. Following fermentation, the culture broth was subjected to ethyl acetate extraction, and staurosporine was isolated through sequential purification steps involving Sephadex LH-20 column chromatography and preparative high-performance liquid chromatography (HPLC). This process yielded approximately 1.1 g of pure staurosporine from 200 L of fermentation broth.
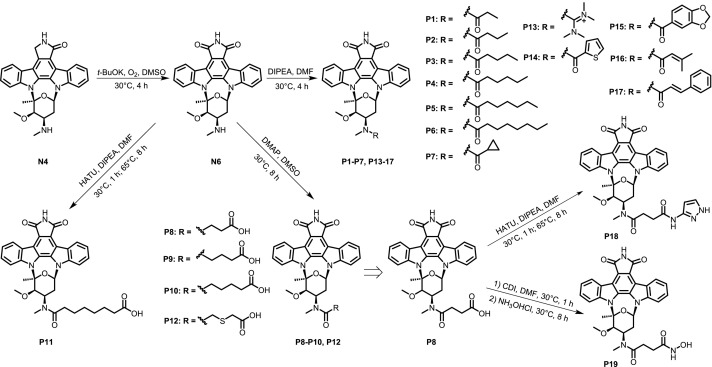
Scheme 1. Synthesis of P1-P19.
The isolated staurosporine was subsequently subjected to regioselective oxidation using DMSO as the reaction medium. In the presence of potassium tert-butoxide as the base and oxygen as the oxidant, the methylene moiety at the C-7 position was selectively converted to a carbonyl functionality. The crude product was purified by silica gel column chromatography, affording N6 in 71% yield. Then N6 served as the key precursor for the synthesis of derivatives P1-7 and P13-17, which were prepared via acylation with appropriate acyl chlorides in DMF using DIPEA as the base. Derivatives P8-P10 and P12 were obtained through ring-opening reactions of N6 with succinic, glutaric, adipic, and 3-thioglutaric anhydrides, respectively, in DMSO with catalytic DMAP. For derivatives P11 and P18-19, HATU-mediated amide coupling between N6 or P8 and the corresponding carboxylic acids was employed in the presence of DIPEA.
The HTRF®KinEASE™ kinase assay kit was utilized to evaluate the PIM1 kinase inhibitory activity of 19 derivatives (P1-P19) designed with the aid of artificial intelligence (Table 2). Among these, 13 compounds exhibited activity below 1 μM, with P19 demonstrating significantly superior inhibitory activity (IC50 = 3.6 nM) compared to the positive control, TP-3654 (IC50 = 31.1 nM).
A comprehensive analysis of the PIM1 kinase inhibitory activity of the 19 7‑carbonyl staurosporine derivatives was conducted to elucidate the SAR at the C-4′ secondary amine position (Table 2). Key findings are summarized as follows: (1) The steric size of the derivatizing group was identified as a crucial determinant of kinase inhibition. When flexible aliphatic chains with varying carbon numbers were used for derivatization, derivatives with carbon numbers not exceeding four (e.g., N50, P1-P2) exhibited favorable kinase inhibitory activity, with IC50 values below 100 nM. However, when the carbon number exceeded four, the inhibitory activity significantly diminished (e.g., P3-P6), with IC50 values exceeding 1 μM. Comparatively, derivatives with rigid benzoyl, 2-thiophenecarbonyl, and 3-methylcrotonyl groups showed better kinase inhibitory activity, with IC50 values below 100 nM. If the derivatizing group size increased, the inhibitory activity markedly decreased (e.g., P15, P17), with IC50 values above 1 μM. (2) Introducing additional hydrogen bond donors or acceptors can enhance kinase inhibitory activity. By incorporating long chains with carboxyl groups as hydrogen bond acceptors, good kinase inhibitory activity was maintained even when the carbon number exceeded four (e.g., P9-P11), with IC50 values below 100 nM. Further introduction of hydrogen bond donors can improve kinase inhibitory activity, as evidenced by P19, which exhibited a six-fold increase in inhibitory activity compared to P8.
MD simulations provided structural insights into the binding modes of representative active derivatives P9, P18, and P19. All three compounds displayed similar binding patterns in the PIM1 active site, where the imide NH forms a stable hydrogen bond with Glu121 (Fig. 7A). In addition, the C-4′ amide group engages in water-mediated interactions with Glu171 and Asp128; specifically, in P19, the terminal hydroxyamino moiety forms direct hydrogen bonds with Asp128. Furthermore, all three derivatives interact with Ser46. Among these residues, Glu121 represents the key anchoring site, whereas Glu171, Asp128, and Ser46 likely contribute additional stabilization to the inhibitor-enzyme complex. In contrast, structural modeling of P19 within the PKCη active site revealed a markedly different interaction pattern responsible for its reduced PKC affinity (Fig. 7A, Table 3). Due to the steric hindrance imposed by Phe644, the imide NH of P19 is unable to form the conventional hydrogen bond with the backbone carbonyl of Glu434 (analogous to Glu121 in PIM1). Instead, it engages in weaker hydrogen-bond interactions with the backbone amide groups of Val436 and Phe435. Compared with hydrogen bonding to a carbonyl acceptor, interactions with backbone amides provide significantly less stabilization, thereby diminishing the overall binding strength to PKCη. This altered hydrogen-bonding geometry likely underlies the reduced inhibitory activity of P19 toward PKC isoforms.
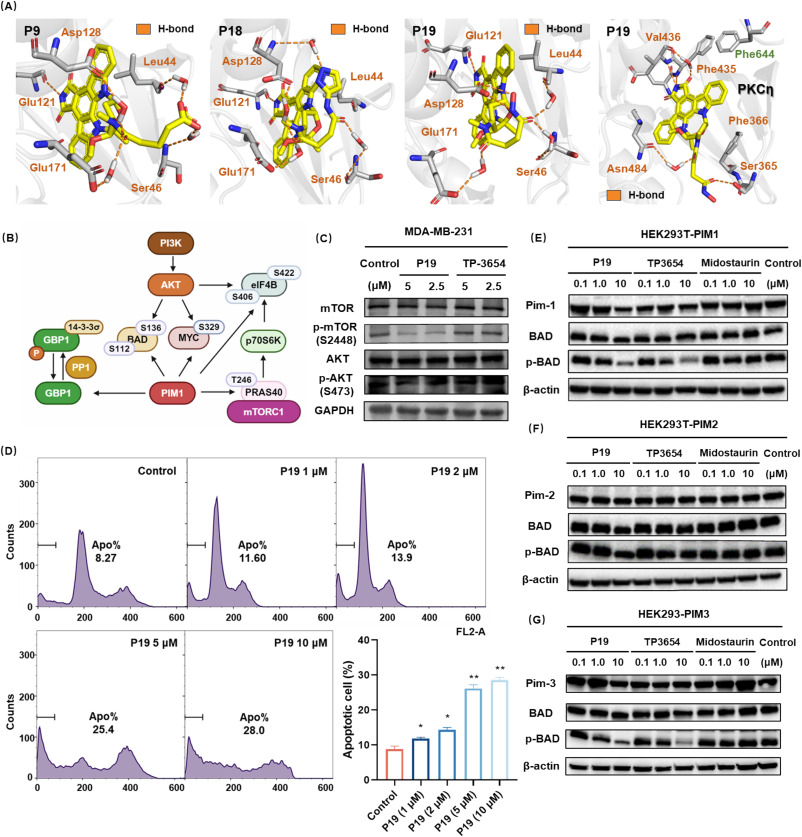
Fig. 7. (A) Representative binding conformations of selected compounds with PIM1 and PKCη, as predicted by MD simulations. (B) The key mechanistic role of PIM1. (C) P19 inhibits the PI3K/AKT/mTOR signaling pathway in MDA-MB-231 cells. (D) PI flow cytometry reveals dose-dependent apoptosis in P19-treated MDA-MB-231 cells. (E-G) Inhibition of PIM1–3 kinase isoforms by compound P19 in HEK293T cells assessed via BAD phosphorylation.
Table 3. Kinase inhibitory activity of P19, N6, TP-3654 and Midostaurin (IC50/nM).
| Kinase | P19 | N6 | TP-3654 | Midostaurin |
|---|---|---|---|---|
| PIM1 | 3.6 | 5.4 | 31.1 | 224.3 |
| PIM2 | 66.5 | 0.4 | 1286.0 | >1000 |
| PIM3 | 6.6 | 0.2 | 472.5 | 199.9 |
| PKCδ | 10.4 | 1.4 | >1000 | / |
| PKCε | 69.0 | 2.3 | >1000 | / |
| PKCη | 73.2 | 2.1 | >1000 | / |
| TRKA | 4.0 | 0.4 | 48.9 | / |
| FLT3 | 5.3 | 15.3 | 512.7 | / |
| TRKB | 13.6 | 2.4 | 247.8 | / |
| PLK1 | 420.9 | 308.1 | >1000 | / |
| PAK4 | 240.2 | 37.0 | >1000 | / |
| HDAC1/6/8 | >1000 | / | / | / |
Among the 7‑carbonyl staurosporine derivatives screened for PIM1 kinase inhibitory activity, compound P19 exhibited the most potent inhibition profile and was subsequently selected for comprehensive characterization. In cytotoxicity assays (Table 4), P19 was effective against triple-negative breast cancer MDA-MB-231 cells (IC50 = 330.5 nM) while displaying greatly reduced toxicity toward non-transformed MCF-10A mammary epithelial cells (IC50 = 473.1 nM) compared with the parent compound N6 (MCF-10A, IC50 = 0.7 nM). When benchmarked against the first-line TNBC agent doxorubicin (MCF-10A, IC50 = 250.8 nM) and the clinical staurosporine analog midostaurin (MCF-10A, IC50 = 51.3 nM), P19 was significantly less cytotoxic to MCF-10A cells while maintaining potent activity against MDA-MB-231 cells. P19 showed inhibitory activity across the tested tumor cell lines, with MDA-MB-231 used as the main TNBC model for subsequent studies. (Table 4).
Table 4. Cytotoxicity of P19, N6, TP-3654, doxorubicin and midostaurin (IC50/nM).
| Cell | P19 | N6 | TP-3654 | Doxorubicin | Midostaurin |
|---|---|---|---|---|---|
| MDA-MB-231 | 330.5 | 132.8 | >5000 | 610.0 | 110.2 |
| MCF-10A | 473.1 | 0.7 | / | 250.8 | 51.3 |
| A549 | 629.5 | 31.5 | >5000 | / | / |
| HepG2 | 671.2 | 160.7 | 2486.5 | / | / |
| SW620 | 762.6 | 86.7 | >5000 | / | / |
| HCT116 | 814.9 | 64.0 | 1935.3 | / | / |
Acquired resistance to PIM1 kinase inhibition in TNBC is often mediated by compensatory activation of alternative signaling pathways, most prominently the PI3K/AKT/mTOR axis [14]. Functional crosstalk between PIM1 and PI3K/AKT/mTOR frequently results in pathway upregulation upon PIM1 inhibition, suggesting that dual pathway suppression could enhance antitumor efficacy (Fig. 7B). Kinase profiling disclosed that, compared with the pan-PIM inhibitor TP-3654, P19 exhibited substantially stronger inhibition of TRKA, TRKB, FLT3, PAK1, and PAK4 (Table 3). All of them directly or indirectly modulate PI3K/AKT/mTOR signaling, thus effectively attenuating pathway activity in TNBC cells. Western blot analysis confirmed these results, showing a pronounced decrease in phosphorylation of key nodes in the PI3K/AKT/mTOR cascade in MDA-MB-231 cells (Fig. 7C). Such multi-kinase pathway modulation translated into potent cytotoxicity (Table 4) and concentration-dependent apoptosis induction, with 28.0% apoptotic cells observed at 10 μM P19 (Fig. 7D).
To further define the kinase-activity profile, P19 was tested against members of the PIM family (PIM1, PIM2, PIM3) in HEK293T cells overexpressing each isoform (Fig. 7E-G). In cells overexpressing PIM1 and PIM3, both P19 and TP-3654 demonstrated robust inhibition at 10 μM, evidenced by a substantial decrease in phosphorylated BAD levels. However, both compounds exhibited markedly diminished inhibitory efficacy against PIM2. This is consistent with previous reports showing that the Km of PIM2 for ATP is up to 100-fold higher than that of PIM1 and PIM3 [36]. Notably, Midostaurin failed to significantly suppress BAD phosphorylation in cells overexpressing any of the three PIM kinases, with particularly negligible activity against PIM2. These cellular observations were corroborated by cell-free kinase inhibition assays, confirming P19's pronounced inhibitory activity against both PIM1 and PIM3 isoforms. Broad screening against 100 kinases revealed that 50 nM P19 inhibited PIM1 by 91.3% and achieved >90% inhibition against 11 additional kinases, including TRKA, FLT1, and TBK1 (Table S2).
Compared with N6, P19 exhibited reduced inhibition of PKCδ, PKCε, and PKCη, indicating improved PKC sparing relative to the parent compound (Table 3). This relative PKC-sparing profile was associated with lower cytotoxicity toward MCF-10A mammary epithelial cells than N6, doxorubicin, or midostaurin, while P19 retained potent antiproliferative activity against MDA-MB-231 cells (Table 4). Collectively, these results indicate that P19 is a PIM1-potent multi-kinase inhibitor with improved PKCδ/ε/η sparing relative to N6. Its antiproliferative activity in MDA-MB-231 cells may result from combined modulation of PIM1 and additional kinase-dependent survival pathways. The relative PKC-sparing profile of P19, together with its reduced cytotoxicity toward MCF-10A cells compared with N6, supports further lead optimization and broader biological evaluation.
To obtain preliminary ex vivo evidence of activity, P19 was evaluated in a single patient-derived breast cancer organoid model, BR-SR-25015 (Fig. 8). The organoids were treated with P19 at inhibitory concentrations ranging from 0.1 nM to 100 μM for three days. Growth of the organoids was monitored by optical microscopy, which revealed that P19 significantly and dose-dependently inhibited cell proliferation and reduced organoid size. Subsequently, cell viability within the organoids was assessed, and the IC50 value was determined by nonlinear regression analysis of the dose-response curve. P19 exhibited an IC50 value of 1.8 μM against BR-SR-25015 (doxorubicin, IC50 = 0.1 μM) demonstrating potent antitumor activity.
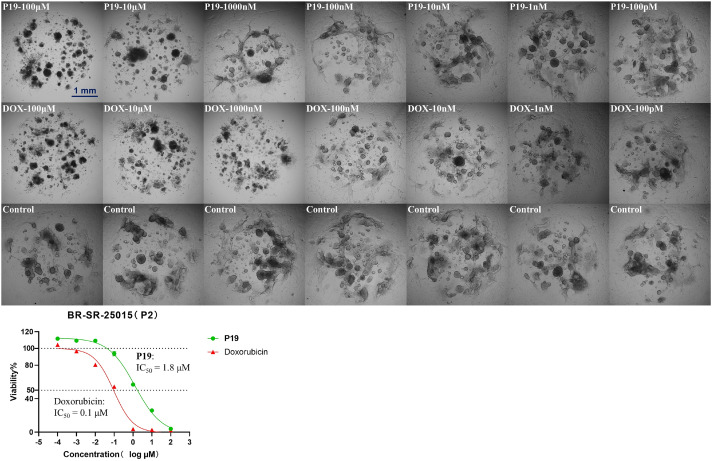
Fig. 8. Evaluation of antitumor activity of P19 in one patient-derived breast cancer organoids.
Regarding its physicochemical profile (Table 5), P19 possesses a polar surface area (PSA) of 89.63 Å2, well within the optimal range for drug candidates (typically <140 Å2 to ensure adequate membrane permeability). The compound exhibits an experimental LogD of 3.94, reflecting balanced lipophilicity that facilitates both membrane penetration and sufficient aqueous solubility. Although P19's molecular weight somewhat exceeds Lipinski's preferred threshold of 500, this remains acceptable by contemporary drug development standards. The experimentally determined aqueous solubility of 1.09 μg/mL is relatively low but remains within a tolerable range for compounds in this therapeutic category.
Table 5. Physicochemical properties of P19.
| PSA (Å2)a | LogD | MW | Solubility (μg/mL) |
|---|---|---|---|
| 89.63 | 3.94 | 595.60 | 1.09 |
Polar surface area was calculated by Schrödinger 12.8.
An orthotopic mouse tumor model was established by inoculating BALB/c nude mice with MDA-MB-231-Luc-mCherry cells. Tumor growth was monitored using an in vivo imaging system, and mice with fluorescence signal intensities exceeding 1.00 × 10⁷ p/s/cm2/sr were selected for subsequent experiments. The experimental groups were administered P19 via intraperitoneal injection at doses of 12.5 mg/kg and 25 mg/kg, while the positive control group received 25 mg/kg of TP-3654 intraperitoneally. Compared to the vehicle control group, the tumor growth inhibition rates (TGI) for P19 at 12.5 mg/kg and 25 mg/kg were 34.7% and 66.3%, respectively, with the 25 mg/kg P19 group outperforming the positive control TP-3654 (TGI = 46.1%) (Fig. 9). Body weights in the control, 12.5 mg/kg P19, and TP-3654 groups remained stable throughout the study, whereas mice receiving 25 mg/kg P19 showed a slight decrease starting on day 5, followed by recovery from day 15 and returning to baseline by day 22. These observations suggest that P19 was preliminarily tolerated under the tested dosing conditions.
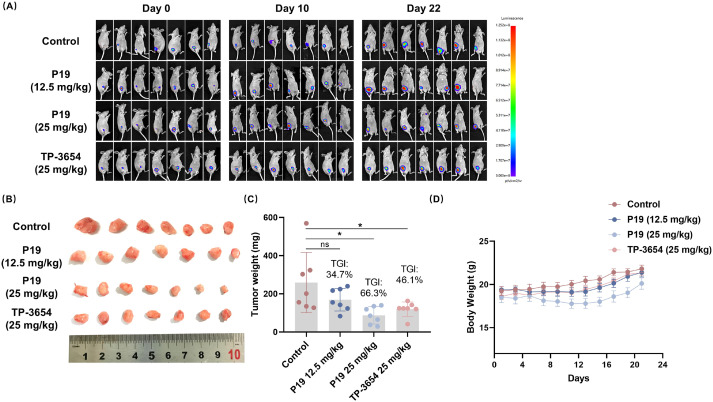
Fig. 9. In vivo antitumor efficacy in an orthotopic mouse tumor model (n = 7). (A) The trend of fluorescence signal changes observed in vivo in nude mice. (B) Representative photographs of excised tumors from each treatment group. (C) Quantitative analysis of tumor weight at the end of the study. (D) Body weight changes during the treatment period. All data are presented as mean ± SD, *p < 0.05, **p < 0.01 vs Control group.
Histopathological analysis by hematoxylin and eosin (H&E) staining showed that tumor cells in the negative control group were densely packed with enlarged, irregular nuclei and marked cellular atypia. In contrast, tumor tissues from the P19-treated groups exhibited increased intercellular space, reduced nuclear-to-cytoplasmic ratios, and more rounded, loosely arranged cells (Fig. 10). Immunohistochemical analysis showed that compared with the control group, the P19-treated groups exhibited significantly decreased expression of the bcl-2 and increased expression of cleaved caspase-3 in tumor tissues (Fig. 10). Hence, P19 induced the apoptosis of tumor cells and inhibited tumor growth in mice. Further H&E staining of major organs (heart, lung, kidney, spleen, and liver) revealed no evident pathological alterations (Fig. 11).
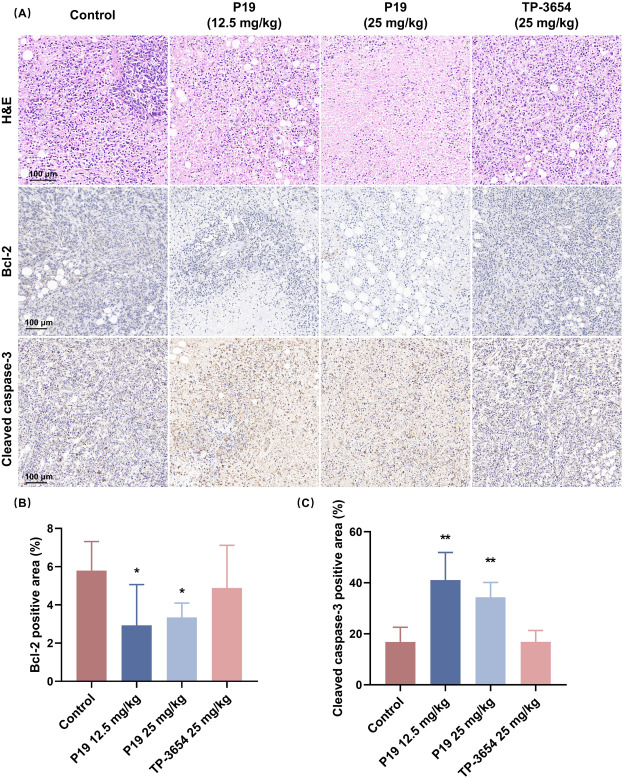
Fig. 10. Effects of P19 on bcl-2 and cleaved caspase-3 in tumor tissues. (A) Representative histopathological images of tumors in each group. (B) Positive area rate of bcl-2. (C) Positive area rate of cleaved caspase-3. All data are presented as mean ± SD, *p < 0.05, **p < 0.01 vs Control group.
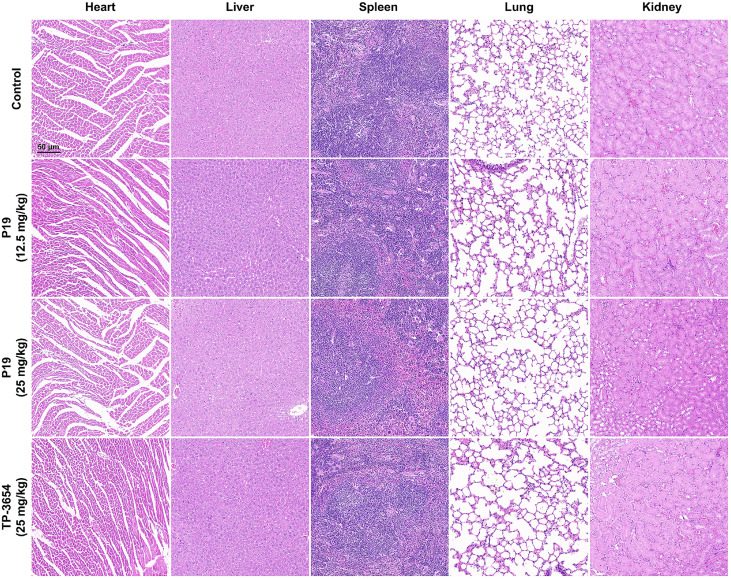
Fig. 11. Representative histopathological images of major organs in each group stained with hematoxylin and eosin.
In acute toxicity studies, the maximum dose of P19 was limited to 125 mg/kg due to solubility constraints. Mice were administered intraperitoneally at 125, 80, and 50 mg/kg, respectively, and survival, body weight changes, and histopathological alterations of major organs were monitored. No mortality occurred within 14 days post-administration. Mice receiving 125 mg/kg exhibited a transient decrease in body weight, which returned to baseline within two weeks (Fig. 12). Necropsy revealed no significant pathological changes in the heart, liver, spleen, lungs, or kidneys.
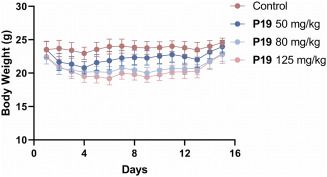
Fig. 12. In vivo acute toxicity tests of P19 in mice (n = 6).
Guanylate-binding protein 1 (GBP1), a member of the GTPase family, is induced by interferons and inflammatory cytokines and is transcriptionally regulated by epidermal growth factor receptor (EGFR) [37]. In various cancers, including glioblastoma, prostate cancer, and esophageal squamous cell carcinoma, GBP1 has been shown to promote tumor proliferation and migration both in vitro and in vivo through the EGFR signaling pathway. Furthermore, in the presence of β-tubulin III, GBP1 recruits PIM1 kinase to the cytoskeleton, thereby activating downstream signaling cascades that facilitate tumor growth and confer resistance to chemotherapy in ovarian and breast cancers [38], [39].
Notably, PIM1 has been demonstrated to phosphorylate GBP1 at Ser156 in THP-1 cells, maintaining GBP1 in a monomeric, GTPase-inactive state [40]. This modification is vital for protecting uninfected cells from innate immune-mediated damage during pathogen clearance. When Ser156 phosphorylation is lost, either through expression of a phosphorylation-deficient GBP1 mutant or inhibition of the GBP1-PIM1 interaction by NSC75609338, dephosphorylated GBP1 aberrantly associates with Golgi membranes. The resulting disruption of Golgi integrity leads to cell death, underscoring PIM1-mediated phosphorylation of GBP1 as a pivotal pro-survival mechanism [39], [40].
Analysis of the TCGA database further revealed that both PIM1 kinase and its downstream effector GBP1 are significantly upregulated in TNBC compared to other breast cancer subtypes and normal tissues, with a strong positive correlation between their expression levels (Fig. S1) [41], [42]. Immunoprecipitation assays confirmed the endogenous interaction between PIM1 and GBP1 in the TNBC cell line MDA-MB-231 (Fig. 13A). Overexpression of PIM1 enhanced GBP1 phosphorylation, whereas knockdown of PIM1 diminished GBP1 phosphorylation (Fig. 13B-D). RNA interference-mediated modulation of PIM1 and GBP1 in MDA-MB-231 cells demonstrated that simultaneous knockdown of both PIM1 and GBP1 prevented cell death induced by PIM1 silencing, suggesting that PIM1 may promote cell survival in MDA-MB-231 cells via the GBP1 pathway (Fig. 13E, F). These data are consistent with the previously reported PIM1/GBP1 pathway, but do not by themselves establish direct causality or define the phosphorylation site in TNBC cells.
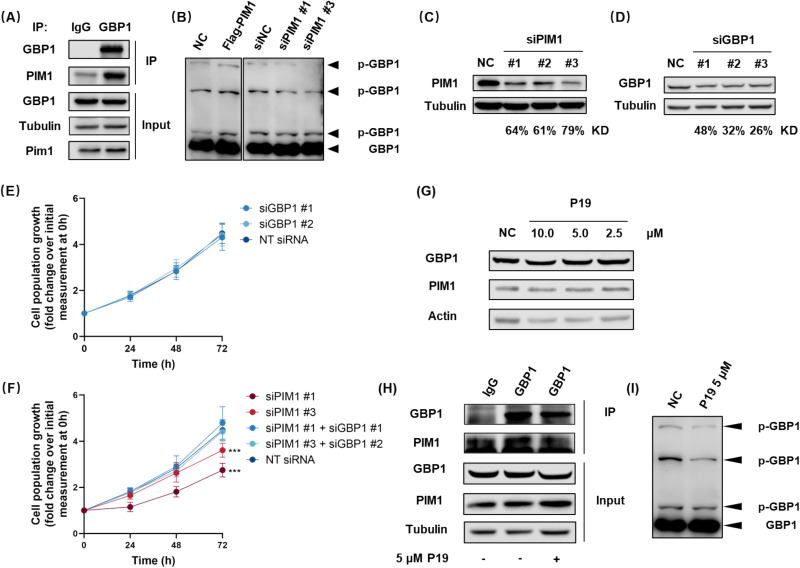
Fig. 13. Functional analysis of PIM1 and GBP1 in MDA-MB-231. (A) Co-immunoprecipitation of PIM1 and GBP1 in MDA-MB-231. (B) Detection of GBP1 phosphorylation by Phos-tag™ SDS-PAGE. (C) PIM1 expression in MDA-MB-231 72 h post siPIM1 transfection. (D) GBP1 expression in MDA-MB-231 72 h post siGBP1 transfection. (E, F) Cell viability assays performed every 24 h following siRNA transfection in MDA-MB-231. (G) Effects of P19 treatment on PIM1 and GBP1 expression levels. (H) Co-immunoprecipitation analysis of PIM1 and GBP1 interaction in MDA-MB-231. (I) Detection of GBP1 phosphorylation by Phos-tag™ SDS-PAGE.
The effect of compound P19 on the PIM1/GBP1 signaling pathway was further investigated at the cellular level. P19 did not alter the expression levels of either GBP1 or PIM1 (Fig. 13G); however, co-immunoprecipitation analysis revealed that P19 treatment reduced the co-immunoprecipitation signal between PIM1 and GBP1 and suppressed GBP1 phosphorylation (Fig. 13H, I). These results suggest that inhibition of PIM1 catalytic activity and the consequent reduction in GBP1 phosphorylation may contribute, at least in part, to the cellular effects of P19. Given the broader kinase profile of P19, additional kinase-dependent mechanisms may also be involved.
In this study, virtual screening targeting PIM1 kinase was conducted against a library of 1056 compounds previously synthesized or isolated by our group. This process identified 51 indolocarbazole derivatives, which were subsequently evaluated for their in vitro PIM1 kinase inhibitory activity. Among these, 16 compounds exhibited strong inhibitory effects on PIM1 kinase, with five of them demonstrating greater potency than the positive control TP-3654. Molecular dynamics simulations revealed that ligand-PIM1 interactions are primarily stabilized through engagement with Glu121, which serves as the key determinant of binding affinity. Glycosylated derivatives more frequently established auxiliary hydrogen-bonding contacts with Asp128, Glu171, or Ser46, further reinforcing inhibition. Comparative structural analysis suggested that the Phe644-containing region of PKCη creates steric constraints that can be exploited to reduce PKC isoform inhibition while retaining PIM1 binding. Therefore, N6 was selected as the lead compound for further optimization, with the aim of preserving PIM1 potency while reducing PKCδ, PKCε, and PKCη inhibition relative to the parent compound. We then utilized a deep learning and genetic algorithm-based structural optimization model developed in our laboratory. Using N6 as the initial population, a diverse set of derivatives was generated through genetic algorithm-driven mutation and crossover, with Bayesian optimization dynamically guiding the evolutionary trajectory. From these derivatives, candidates were selected based on potent predicted PIM1 binding, reduced PKCδ/ε/η inhibition relative to N6, and synthetic feasibility.
The promising candidates were synthesized via semi-synthetic methods. Among these, P19 displayed remarkable PIM1 inhibitory activity in vitro (IC50 = 3.6 nM), substantially surpassing that of the reference drug TP-3654 (IC50 = 31.1 nM). Further kinase profiling demonstrated that structural optimization improved PKC sparing relative to N6, although P19 retained substantial activity against several non-PKC kinases. Compared to N6 (PKCδ IC50 = 1.4 nM; PKCε IC50 = 2.3 nM; PKCη IC50 = 2.1 nM), P19 exhibited much weaker inhibition of these off-target kinases (PKCδ IC50 = 10.4 nM; PKCε IC50 = 69.0 nM; PKCη IC50 = 73.2 nM). Notably, P19 exhibited considerably lower cytotoxicity toward normal human mammary epithelial MCF-10A cells (N6 IC50 = 0.7 nM; P19 IC50 = 473.1 nM), while maintaining potent inhibitory activity against MDA-MB-231 triple-negative breast cancer cells (N6 IC50 = 132.8 nM; P19 IC50 = 330.5 nM).
In patient-derived breast cancer organoids, P19 demonstrated significant therapeutic efficacy with an IC50 of 1.8 μM. In a murine orthotopic TNBC model, P19 demonstrated potent in vivo efficacy, achieving the TGI rate of 66.3% at a 25 mg/kg dose, outperforming TP-3654 (TGI = 46.1% at 25 mg/kg). Consistent with previous reports linking PIM1 to GBP1 phosphorylation, our cellular data showed an endogenous PIM1-GBP1 association in MDA-MB-231 cells and reduced GBP1 phosphorylation after P19 treatment. These findings suggest, but do not prove, that the PIM1/GBP1 axis may be involved in the cellular activity of P19. Further studies will be required to establish causality.
Collectively, these findings identify P19 as a promising multi-kinase lead with potent PIM1 activity and improved PKC-sparing properties, with potential for future development in TNBC.
The PIM1 protein kinase inhibition assay was conducted using the HTRF KinEASE kit (PerkinElmer, #62ST2PEB) for full IC50 determination.
The wild-type screening was performed by ICE Bioscience Inc., using HTRF kinase assay and ADP-Glo kinase assay as described previously. The average inhibition over 100 kinases were reported.
Cells were obtained from the Type Culture Collection of the Chinese Academy of Sciences (Shanghai, China). Compounds were tested for their cytotoxic activities in vitro using the SRB assay. All cells were cultured with suitable culture medium at 37 °C in a humidified atmosphere containing 5% CO2. Logarithmic phase cells were collected and seeded in 96-well plates at a density of 5 × 10³ cells per well for overnight incubation. All cells were incubated with compounds for 72 h with three replicates set for each concentration. Followingly, the culture medium was removed and replaced with 100 μL of a 10% trichloroacetic acid solution to fix the cells at 4 °C for at least 2 h. Once fixed, the trichloroacetic acid solution was removed and each well was washed with flowing water at least four times before being dried. SRB (sulforhodamine B) solution was prepared by dissolving 0.4% SRB in a 1% acetic acid solution, which was then added to each well for staining for 20 min. Subsequently, the wells were washed four times with 1% acetic acid solution before being dried again. Each well received an addition of 100 μL of a 10 mM Tris solution and was shaken thoroughly to dissolve the protein-bound dye completely. The absorbance of each well was measured at a wavelength of 515 nm using an ELISA reader. The inhibition rate was calculated using the formula: Inhibition rate = (OD value of control group - OD value of treatment group)/OD value of control group ×100%. The IC50 value was calculated using Calcusyn software.
Logarithmic phase MDA-MB-231 cells were seeded at a density of 5 × 10⁶ cells per well in a six-well plate and incubated overnight in a CO2 incubator. The old culture medium was removed, and the cells were treated with fresh medium containing different concentrations of compound P19 or DMSO for 24 h. The cells were then collected by centrifugation at 1000 rpm for 10 min, washed with phosphate-buffered saline (PBS), and fixed with 75% ethanol at −20 °C overnight. After centrifuging the cells again at 1000 rpm for 5 min and discarding the supernatant, the cells were washed twice with PBS to remove all ethanol. Next, the cells were incubated with Hank's balanced salt solution containing 50 mg/mL RNase A and 50 mg/mL propidium iodide at room temperature for 30 min. Finally, cell cycle analysis was performed using a Gallios flow cytometer (BD counter).
The crystal structures of PIM1 (PDB ID: 1XWS) were obtained from the Protein Data Bank. Docking studies were conducted using the Glide software (Schrödinger suite, version 12.8). Prior to docking, the PIM1 protein structures were prepared using the Protein Preparation Wizard with the OPLS4 force field. Bond orders were reassigned, hydrogens were added, and missing side chains were filled using the prime module. Water molecules and co-crystallized ions were removed, and hydrogen bonds were reassigned using PROPKA. The entire structures were then energy-minimized using the OPLS4 force field with default parameters. Ligand structures were generated using the 2D Sketcher module and further prepared using the Ligprep module with default criteria. The docking grid box was generated based on the ligand site. Docking calculations were performed in the Standard Precision (SP) scoring mode. To study the binding modes predicted by molecular docking, MD simulations were conducted using the Desmond software. The systems were embedded in a SPC water box extending approximately 10 Å in each direction. Sodium and chloride ions were added randomly to achieve a neutralized system and an experimental salt concentration of 0.15 M NaCl. After equilibration using default settings, each system underwent a 40 ns production phase in the NPT ensemble, with a Nose-Hover thermostat at 300 K and Martyna-Tobias-Klein barostats at 1.01325 bar pressure. During the 40 ns simulation, the energy and trajectory of the systems were calculated and recorded every 5.0 and 1.2 ps, respectively.
All animal experiments were carried out according to the Institutional Animal Care and Use Committee (IACUC) of Zhejiang University, Hangzhou, China (approved protocol number 33815). And all animal care procedures were performed according to the Guide for Care and Use of Laboratory Animals. Female BALB/c nude mice aged 4–6 weeks were purchased from Hangzhou Paisao Biotechnology Co, LTD (Hangzhou, China). Injection of as few as 1 × 10⁵ MDA-MB-231-Luc-mCherry cells into the mammary gland can result in the formation of a single tumor nodule at the injection site. Consequently, this model accurately represents human primary mammary carcinoma. Nearly 100% of the mice develop tumors in the orthotopic location. Tumors were observed approximately 24 days after the injection of tumor cells. Consequently, this orthotopic breast cancer model is considered highly suitable for evaluating the efficacy of chemotherapeutic agents against all stages of mammary carcinoma. The mice were kept in a specific pathogen-free (SPF) animal facility. Mice with baseline fluorescence signals exceeding 1.00 × 10⁷ p/s/cm2/sr were enrolled and randomly assigned to groups, with comparable baseline tumor burdens across groups. The mice were randomly divided into 4 groups: control group, P19 (12.5 mg/kg) group, P19 (25 mg/kg) group, and TP-3654 (25 mg/kg) group, with 7 mice in each group. P19 and TP-3654 were freshly prepared in a vehicle consisting of 10% ethanol, 10% Cremophor EL, and 80% PBS, and were fully dissolved to yield clear, homogeneous solutions prior to administration. The experimental group animals were administered intraperitoneal injections once daily according to the designed concentration: positive control group received TP-3654 at a dose of 25 mg/kg, the experimental groups received P19 at doses of 12.5 mg/kg and 25 mg/kg, respectively, and the control group received an equivalent volume of solvent. Daily observations of behavior and monitoring of body weight were conducted for each group of mice. Tumor burden was monitored by in vivo imaging system. The prespecified endpoint was day 23 after treatment initiation or earlier if humane endpoints were reached. Image quantification and endpoint assessment were performed by investigators blinded to treatment allocation. After 23 days of intraperitoneal administration, the mice were sacrificed, and tumor, heart, spleen, liver, lung, and kidney samples were collected.
Male and female BALB/c mice (4–6 weeks old) were randomly assigned to four groups (n = 6, 3 males and 3 females per group) and treated via intraperitoneal injection. The control group received the same volume of vehicle, while the treatment groups were administered a single dose of the P19 at 125, 80, or 50 mg/kg, respectively. Mice were observed for 14 days post-dosing for behavioral changes, body weight variation, and mortality. At the end of the observation period, mice were euthanized, and the heart, liver, spleen, lung, and kidney were collected for gross examination and H&E staining.
The mouse tumors or tissue were fixed, embedded in paraffin, and sliced into 5 μm sections. The tissue sections were subjected to histopathological evaluation by staining with hematoxylin and eosin (H&E). The sections were first deparaffinized by soaking in two changes of xylene for 15 min followed by a series of decreasing concentrations of alcohol and finally tap water. Then, the sections were stained with Harris's hematoxylin reagent for 5 min, destained in 1% acid-alcohol for 30 s, and washed with running tap water. Next, they were stained with eosin for 5 min and washed again with tap water. After dehydration using alcohol and xylene, the sections were sealed with neutral resin before being observed under a microscope to evaluate their histopathology. The slices of tumor tissues were immunostained with bcl-2 and cleaved caspase-3 antibodies, according to the manufacturer's protocol supplied by Servicebio. Micrographs were acquired using a fluorescence inverted microscope DM18 (Leica, Germany).
GraphPad Prism 8 software (GraphPad Software) was used for statistical analysis. Unless otherwise indicated, all experiments were independently repeated at least three times, and independent repeats were considered biological replicates. Data are presented as mean ± SD. Statistical analyses were performed using unpaired t-tests, one-way ANOVA, or two-way ANOVA, as appropriate. Data were assessed for normality, and nonparametric tests were applied when assumptions of normality were not met. Significant main effects or interactions were followed by post hoc multiple comparisons using Tukey's test for parametric data or Dunn's test post hoc for nonparametric data. A p-value <0.05 was considered statistically significant.
BR-SR-25015 organoids were seeded in 96-well plates at one organoid per well and treated with test compounds at seven concentrations, with three technical replicate wells per concentration. Vehicle-treated wells containing 0.1% DMSO served as controls. After 72 h, ATP-based viability was assessed using the CellTiter-Glo 3D assay. IC50 values were determined by nonlinear regression of vehicle-normalized dose-response curves using GraphPad Prism.
The synthesis of P1-P19 has been described in Scheme 1. All target compounds are >95% pure by HPLC analysis. The purity of P19 used for animal study was ≥99%. All chemicals were purchased from Aladdin, Bidepharm or Sigma Aldrich and were used without additional purification. All solvents used for column chromatography (CC) were of analytical grade (Shanghai Chemical Reagents Co., Ltd. China), and solvents used for HPLC were of HPLC grade (J & K Scientific Ltd.). Silica gel (100–200, 200–300 mesh, Qingdao Haiyang Chemical Co., Ltd.) was used for CC. Precoated silica gel GF254 plates (Qingdao Haiyang Chemical Co., Ltd. China) were used for TLC monitors. HPLC analysis was performed on Shimadzu High-Performance Liquid Chromatography using Agilent ODS column (10 μm, 4.6 250 mm). Preparative HPLC was performed on Beijing Chuangxintongheng LC3000 Semi-preparation Gradient HPLC using an Agilent C18 column (5 μm, 21.2 250 mm). NMR spectra were obtained on JEOL JNM-ECZR instrument. HRESIMS were obtained on an Agilent 6230 TOF LC/MS system mass spectrometer. Reactions were monitored by TLC.
The strain (Streptomyces sp. SS-13G) was isolated from sediment samples collected from the coastal areas of the Shengsi Archipelago, Zhoushan, Zhejiang Province, China. The isolation and purification were performed using GS agar medium, which was composed of (per liter, pH 7.2–7.4): soluble starch (20.0 g), KNO3 (1.0 g), KH2PO4 (0.5 g), MgSO4·7H2O (0.5 g), FeSO4·7H2O (0.01 g), and sea salt (25.0 g) and for solid media, agar powder (20.0 g). The isolate was identified based on its morphological characteristics and 16S rDNA gene sequence analysis, the latter being conducted by Sangon Biotech (Shanghai, China).
Streptomyces sp. SS-13G was cultured at 28 °C in GS liquid medium (autoclaved at 121 °C for 20 min) using 500 mL Erlenmeyer flasks. A total of 800 flasks (equivalent to 200 L culture) were incubated in a constant-temperature shaker at 28 °C with agitation at 180 rpm for 10 days. The resulting fermentation broth was extracted three times with ethyl acetate, and the combined organic layers were concentrated under reduced pressure to yield 4.3 g of crude ethyl acetate extract. Preliminary fractionation of the crude extract was performed via gel column chromatography using a dichloromethane/methanol (1,1, v/v) mixture as the eluent, affording 2.4 g of fractions enriched in staurosporine (N4). Further purification was achieved by medium-pressure liquid chromatography using a 30–100% gradient elution of methanol-water containing 0.05% trifluoroacetic acid (TFA) at a flow rate of 10 mL/min, and detection at 292 nm. Final concentration under reduced pressure provided 1.1 g of staurosporine-enriched fraction.
White solid. 1H NMR (600 MHz, Methanol‑d4): δ 9.22 (d, J = 8.0 Hz, 1H), 7.96 (d, J = 8.0 Hz, 1H), 7.85 (d, J = 8.0 Hz, 1H), 7.52 (t, J = 8.0 Hz, 1H), 7.42 (t, J = 8.0 Hz, 1H), 7.37 (t, J = 8.0 Hz, 1H), 7.26 (t, J = 8.0 Hz, 1H), 7.19 (d, J = 8.0 Hz, 1H), 6.50 (dd, J = 9.4, 2.6 Hz, 1H), 4.78 (d, J = 17.3 Hz, 1H), 4.52 (d, J = 17.3 Hz, 1H), 4.23 (s, 1H), 4.00–3.93 (m, 1H), 3.25–3.16 (m, 1H), 2.79 (s, 3H), 2.52 (s, 3H), 2.17 (s, 3H), 2.16–2.10 (m, 1H). 13C NMR (150 MHz, Methanol‑d4): δ 174.9, 139.3, 137.6, 133.6, 131.3, 127.5, 127.0, 126.4, 126.3, 125.7, 124.3, 122.6, 121.8, 120.6, 120.1, 116.7, 115.6, 113.2, 109.2, 94.0, 81.8, 81.2, 60.5, 55.7, 46.7, 31.1, 28.6, 28.5. HRESIMS found m/z 467.2076 [M + H]+ (calcd for C28H27N4O3, 467.2083).
A portion of staurosporine (N4, 0.10 g, 0.215 mmol) was weighed into a 50 mL reaction flask and dissolved in 5 mL of DMSO. Potassium tert-butoxide (0.30 g, 2.674 mmol) was then added, upon which the solution turned dark purple. The reaction mixture was stirred under an oxygen atmosphere at 30 °C for 4 h, and the progress was monitored by thin-layer chromatography (TLC). Upon completion, the reaction was quenched with 50 mL of water, followed by extraction with ethyl acetate (3 × 50 mL) to remove the majority of DMSO. The combined organic layers were concentrated under reduced pressure. The residual staurosporine was subjected to the same oxidative reaction, and the ethyl acetate extracts were combined. Further purification was performed by gel column chromatography using methanol as the eluent to remove residual DMSO and byproducts, affording 7‑carbonyl staurosporine (N6) in an overall yield of approximately 70.6%.
Yellow solid (yield 70.6%). 1H NMR (600 MHz, Methanol‑d4): δ 9.21 (d, J = 8.0 Hz, 1H), 9.02 (d, J = 8.0 Hz, 1H), 7.91 (d, J = 8.0 Hz, 1H), 7.50–7.44 (m, 2H), 7.35 (d, J = 8.0 Hz, 1H), 7.31–7.26 (m, 2H), 6.56–6.52 (m, 1H), 4.02 (d, J = 2.6 Hz, 1H), 3.41 (s, 1H), 2.84 (s, 3H), 2.78–2.68 (m, 1H), 2.40–2.35 (m, 1H), 2.34 (s, 3H), 1.97 (s, 3H). 13C NMR (150 MHz, Methanol‑d4): δ 172.5, 172.3, 141.3, 139.1, 132.4, 131.4, 127.6, 127.2, 126.4, 126.3, 124.6, 123.1, 121.6, 121.4, 121.2, 120.1, 117.7, 116.4, 114.6, 109.3, 93.3, 83.5, 81.9, 58.8, 53.2, 32.7, 30.2, 29.6. HRESIMS found m/z 481.1875 [M + H]+ (calcd for C28H25N4O4, 481.1876).
A sample of 7‑carbonyl staurosporine (N6, 10.0 mg, 0.021 mmol) was placed in a 25 mL reaction flask and dissolved in 2 mL of chloroform. Subsequently, DIPEA (40 μL, 0.230 mmol) and propionyl chloride (40 μL, 0.476 mmol) were added, and the reaction mixture was stirred at 30 °C for 4 h. The progress of the reaction was monitored by TLC. Upon completion, the reaction was quenched with saturated sodium bicarbonate, and the mixture was extracted with ethyl acetate (3 × equal volume). The combined organic layers were concentrated under reduced pressure, and the residue was purified by preparative HPLC using a 50–100% gradient elution of methanol-water containing 0.05% TFA as the mobile phase at a flow rate of 10 mL/min, with detection at 318 nm.
Yellow solid (yield 35.8%). 1H NMR (600 MHz, DMSO‑d6): δ 11.14 (s, 1H), 9.26 (d, J = 8.0 Hz, 1H), 9.09 (d, J = 8.0 Hz, 1H), 8.04 (d, J = 8.0 Hz, 1H), 7.73 (d, J = 8.0 Hz, 1H), 7.62 (t, J = 8.0 Hz, 1H), 7.56 (t, J = 8.0 Hz, 1H), 7.43 (t, J = 8.0 Hz, 1H), 7.40 (t, J = 8.0 Hz, 1H), 7.06 (dd, J = 8.8, 6.0 Hz, 1H), 5.07 (ddd, J = 13.1, 4.6, 2.4 Hz, 1H), 4.26–4.23 (m, 1H), 2.80 (s, 3H), 2.75–2.69 (m, 1H), 2.66 (s, 3H), 2.39–2.35 (m, 5H), 2.28 (td, J = 13.1, 6.0 Hz, 1H), 1.05 (t, J = 7.3 Hz, 3H). 13C NMR (150 MHz, DMSO‑d6): δ 173.6, 171.2, 170.9, 139.8, 137.7, 130.6, 128.8, 127.2, 126.9, 125.0, 124.9, 122.8, 121.5, 120.9, 120.7, 120.7, 119.6, 116.1, 115.2, 113.6, 109.9, 95.0, 83.3, 82.5, 60.4, 47.8, 30.7, 29.2, 26.9, 26.4, 9.2. HRESIMS found m/z 559.1957 [M + Na]+ (calcd for C31H28N4O5Na, 559.1957).
Yellow solid (yield 34.9%). 1H NMR (600 MHz, DMSO‑d6): δ 11.13 (s, 1H), 9.26 (d, J = 8.0 Hz, 1H), 9.09 (d, J = 8.0 Hz, 1H), 8.04 (d, J = 8.0 Hz, 1H), 7.73 (d, J = 8.0 Hz, 1H), 7.61 (t, J = 8.0 Hz, 1H), 7.56 (t, J = 8.0 Hz, 1H), 7.45–7.38 (m, 2H), 7.05 (dd, J = 8.8, 6.0 Hz, 1H), 5.06 (ddd, J = 13.0, 4.6, 2.4 Hz, 1H), 4.26–4.23 (m, 1H), 2.80 (s, 3H), 2.75–2.69 (m, 1H), 2.67 (s, 3H), 2.37 (s, 3H), 2.33 (td, J = 7.4, 4.2 Hz, 2H), 2.28 (td, J = 13.0, 6.0 Hz, 1H), 1.58 (h, J = 7.4 Hz, 2H), 0.93 (t, J = 7.4 Hz, 3H). 13C NMR (150 MHz, DMSO‑d6): δ 172.8, 171.2, 170.9, 139.8, 137.7, 130.5, 128.7, 127.2, 126.9, 125.0, 124.9, 122.8, 121.4, 120.9, 120.7, 120.6, 119.6, 116.1, 115.2, 113.6, 109.9, 95.0, 83.3, 82.4, 60.4, 47.8, 35.0, 30.9, 29.2, 26.8, 18.0, 13.9. HRESIMS found m/z 551.2297 [M + H]+ (calcd for C32H31N4O5, 551.2294).
Yellow solid (yield 51.9%). 1H NMR (600 MHz, DMSO‑d6): δ 11.13 (s, 1H), 9.26 (d, J = 8.0 Hz, 1H), 9.08 (d, J = 8.0 Hz, 1H), 8.03 (d, J = 8.0 Hz, 1H), 7.72 (d, J = 8.0 Hz, 1H), 7.61 (t, J = 8.0 Hz, 1H), 7.55 (t, J = 8.0 Hz, 1H), 7.45–7.37 (m, 2H), 7.05 (dd, J = 8.8, 6.0 Hz, 1H), 5.05 (ddd, J = 13.1, 4.6, 2.5 Hz, 1H), 4.25–4.22 (m, 1H), 2.80 (s, 3H), 2.74–2.68 (m, 1H), 2.66 (s, 3H), 2.37 (s, 3H), 2.34 (td, J = 7.4, 2.1 Hz, 2H), 2.27 (td, J = 13.1, 6.0 Hz, 1H), 1.53 (p, J = 7.4 Hz, 2H), 1.37–1.29 (m, 2H), 0.89 (t, J = 7.4 Hz, 3H). 13C NMR (150 MHz, DMSO‑d6): δ 173.0, 171.2, 170.9, 139.8, 137.6, 130.5, 128.7, 127.2, 126.9, 125.0, 124.9, 122.8, 121.5, 120.9, 120.7, 120.6, 119.6, 116.1, 115.2, 113.6, 109.8, 95.0, 83.3, 82.4, 60.4, 47.8, 32.8, 30.9, 29.2, 26.8, 26.7, 22.0, 14.0. HRESIMS found m/z 565.2447 [M + H]+ (calcd for C33H33N4O5, 565.2451).
Yellow solid (yield 66.4%). 1H NMR (600 MHz, DMSO‑d6): δ 11.14 (s, 1H), 9.26 (d, J = 8.0 Hz, 1H), 9.08 (d, J = 8.0 Hz, 1H), 8.03 (d, J = 8.0 Hz, 1H), 7.72 (d, J = 8.0 Hz, 1H), 7.61 (t, J = 8.0 Hz, 1H), 7.55 (t, J = 8.0 Hz, 1H), 7.45–7.37 (m, 2H), 7.05 (dd, J = 8.8, 6.0 Hz, 1H), 5.05 (ddd, J = 13.1, 4.6, 2.4 Hz, 1H), 4.25–4.22 (m, 1H), 2.79 (s, 3H), 2.75–2.68 (m, 1H), 2.66 (s, 3H), 2.36 (s, 3H), 2.33 (td, J = 7.2, 1.7 Hz, 2H), 2.27 (td, J = 13.1, 6.0 Hz, 1H), 1.58–1.51 (m, 2H), 1.35–1.25 (m, 4H), 0.91–0.84 (m, 3H). 13C NMR (150 MHz, DMSO‑d6): δ 173.0, 171.2, 170.9, 139.8, 137.6, 130.5, 128.7, 127.2, 126.9, 125.0, 124.9, 122.8, 121.5, 120.9, 120.7, 120.6, 119.6, 116.1, 115.2, 113.6, 109.8, 95.0, 83.3, 82.4, 60.4, 47.8, 33.1, 31.1, 30.9, 29.2, 26.8, 24.3, 22.1, 14.0. HRESIMS found m/z 579.2612 [M + H]+ (calcd for C34H35N4O5, 579.2607).
Yellow solid (yield 36.5%). 1H NMR (600 MHz, DMSO‑d6): δ 11.14 (s, 1H), 9.26 (d, J = 8.0 Hz, 1H), 9.09 (d, J = 8.0 Hz, 1H), 8.04 (d, J = 8.0 Hz, 1H), 7.73 (d, J = 8.0 Hz, 1H), 7.62 (t, J = 8.0 Hz, 1H), 7.56 (t, J = 8.0 Hz, 1H), 7.46–7.37 (m, 2H), 7.06 (dd, J = 8.8, 6.1 Hz, 1H), 5.05 (ddd, J = 13.1, 4.6, 2.4 Hz, 1H), 4.26–4.22 (m, 1H), 2.80 (s, 3H), 2.75–2.69 (m, 1H), 2.68 (s, 3H), 2.37 (s, 3H), 2.34 (td, J = 7.2, 2.0 Hz, 2H), 2.27 (td, J = 13.1, 6.1 Hz, 1H), 1.54 (p, J = 7.2 Hz, 2H), 1.34–1.20 (m, 6H), 0.90–0.83 (m, 3H). 13C NMR (150 MHz, DMSO‑d6): δ 173.0, 171.2, 170.9, 139.8, 137.7, 130.5, 128.7, 127.2, 126.9, 125.0, 124.9, 122.8, 121.4, 120.9, 120.7, 120.6, 119.6, 116.1, 115.2, 113.6, 109.9, 95.0, 83.3, 82.4, 60.4, 47.8, 33.1, 31.3, 30.9, 29.2, 28.6, 26.8, 24.5, 22.2, 14.1. HRESIMS found m/z 593.2764 [M + H]+ (calcd for C35H37N4O5, 593.2764).
Yellow solid (yield 38.8%). 1H NMR (600 MHz, DMSO‑d6): δ 11.14 (s, 1H), 9.26 (d, J = 8.0 Hz, 1H), 9.09 (d, J = 8.0 Hz, 1H), 8.03 (d, J = 8.0 Hz, 1H), 7.73 (d, J = 8.0 Hz, 1H), 7.61 (t, J = 8.0 Hz, 1H), 7.56 (t, J = 8.0 Hz, 1H), 7.45–7.37 (m, 2H), 7.05 (dd, J = 8.8, 6.1 Hz, 1H), 5.05 (ddd, J = 13.1, 4.6, 2.5 Hz, 1H), 4.26–4.21 (m, 1H), 2.80 (s, 3H), 2.74–2.68 (m, 1H), 2.67 (s, 3H), 2.37 (s, 3H), 2.35–2.31 (m, 2H), 2.27 (td, J = 13.1, 6.1 Hz, 1H), 1.54 (p, J = 7.2 Hz, 2H), 1.31–1.22 (m, 8H), 0.88–0.82 (m, 3H). 13C NMR (150 MHz, DMSO‑d6): δ 173.0, 171.2, 170.9, 139.8, 137.7, 130.5, 128.7, 127.2, 126.9, 125.0, 124.9, 122.8, 121.4, 120.9, 120.7, 120.6, 119.6, 116.1, 115.2, 113.6, 109.9, 95.0, 83.3, 82.4, 60.4, 47.8, 33.1, 31.3, 30.9, 29.2, 28.9, 28.7, 26.8, 24.6, 22.2, 14.1. HRESIMS found m/z 607.2926 [M + H]+ (calcd for C36H39N4O5 607.2920).
Yellow solid (yield 41.2%). 1H NMR (600 MHz, DMSO‑d6): δ 11.13 (s, 1H), 9.26 (d, J = 8.0 Hz, 1H), 9.09 (d, J = 8.0 Hz, 1H), 8.02 (d, J = 8.0 Hz, 1H), 7.73 (d, J = 8.0 Hz, 1H), 7.62 (t, J = 8.0 Hz, 1H), 7.55 (t, J = 8.0 Hz, 1H), 7.46–7.37 (m, 2H), 7.05 (dd, J = 8.8, 6.1 Hz, 1H), 5.02 (ddd, J = 13.0, 4.5, 2.5 Hz, 1H), 4.28–4.23 (m, 1H), 2.98 (s, 3H), 2.79–2.71 (m, 1H), 2.70 (s, 3H), 2.35 (s, 3H), 2.30 (td, J = 13.0, 6.1 Hz, 1H), 1.99–1.91 (m, 1H), 0.93–0.73 (m, 4H). 13C NMR (150 MHz, DMSO‑d6): δ 173.3, 171.1, 170.9, 139.9, 137.7, 130.5, 128.7, 127.2, 126.8, 124.9, 124.9, 122.8, 121.4, 120.9, 120.7, 120.6, 119.6, 116.1, 115.2, 113.6, 109.8, 95.0, 83.2, 82.4, 60.4, 48.3, 31.0, 29.2, 26.8, 11.3, 7.5, 7.1. HRESIMS found m/z 549.2138 [M + H]+ (calcd for C32H29N4O5 549.2138).
Yellow solid (yield 82.1%). 1H NMR (600 MHz, Methanol‑d4): δ 9.36 (d, J = 8.0 Hz, 1H), 9.18 (d, J = 8.0 Hz, 1H), 8.12 (d, J = 8.0 Hz, 1H), 7.70 (t, J = 8.0 Hz, 2H), 7.62 (d, J = 8.0 Hz, 1H), 7.50 (t, J = 8.0 Hz, 2H), 6.97 (dd, J = 9.7, 3.0 Hz, 1H), 4.52 (s, 1H), 4.15–4.08 (m, 1H), 3.51 (s, 6H), 3.47–3.41 (m, 1H), 3.30 (s, 3H), 3.29 (s, 3H), 2.88 (s, 3H), 2.61 (s, 3H), 2.41 (s, 3H), 2.40–2.35 (m, 1H). 13C NMR (150 MHz, Methanol‑d4): δ 165.5, 165.4, 152.7, 140.8, 139.7, 133.5, 132.3, 129.3, 129.2, 126.6, 126.3, 124.3, 122.9, 122.9, 122.8, 120.6, 119.0, 118.8, 118.1, 113.5, 110.6, 94.8, 82.6, 81.0, 61.0, 55.5, 42.5, 42.5, 41.6, 41.6, 31.3, 28.4, 28.2. HRESIMS found m/z 579.2715 M+ (calcd for C33H35N6O4+ 579.2714).
Yellow solid (yield 45.6%). 1H NMR (600 MHz, DMSO‑d6): δ 11.14 (s, 1H), 9.27 (d, J = 8.0 Hz, 1H), 9.09 (d, J = 8.0 Hz, 1H), 8.06 (d, J = 8.0 Hz, 1H), 7.83 (d, J = 5.0 Hz, 1H), 7.73 (d, J = 8.0 Hz, 1H), 7.65–7.54 (m, 3H), 7.46–7.38 (m, 2H), 7.18 (s, 1H), 7.13–7.03 (m, 1H), 5.01 (s, 1H), 4.48 (s, 1H), 3.06 (s, 3H), 2.96–2.87 (m, 1H), 2.68 (s, 3H), 2.46–2.27 (m, 4H). 13C NMR (150 MHz, DMSO‑d6): δ 171.1, 170.9, 164.1, 139.8, 137.9, 137.7, 130.6, 130.4, 129.7, 128.8, 127.5, 127.2, 126.9, 125.0, 125.0, 122.8, 121.5, 121.0, 120.7, 120.7, 119.6, 116.1, 115.2, 113.5, 109.8, 95.0, 83.4, 82.4, 60.3, 48.7, 33.6, 29.1, 27.0. HRESIMS found m/z 591.1694 [M + H]+ (calcd for C33H27N4O5S 591.1702).
Yellow solid (yield 46.6%). 1H NMR (600 MHz, Chloroform‑d): δ 9.39 (d, J = 8.0 Hz, 1H), 9.25 (d, J = 8.0 Hz, 1H), 7.77 (d, J = 8.0 Hz, 1H), 7.61 (t, J = 8.0 Hz, 1H), 7.57–7.52 (m, 2H), 7.47 (t, J = 8.0 Hz, 1H), 7.44 (t, J = 8.0 Hz, 1H), 7.32 (d, J = 8.0 Hz, 1H), 6.96 (s, 1H), 6.93 (s, 1H), 6.86 (s, 1H), 6.78 (s, 1H), 6.03 (s, 2H), 5.21 (s, 1H), 4.22 (s, 1H), 2.92 (s, 3H), 2.82 (s, 1H), 2.78–2.69 (m, 1H), 2.56 (s, 3H), 2.44 (s, 3H). 13C NMR (150 MHz, Chloroform‑d): δ 171.9, 169.9, 169.7, 149.2, 147.8, 139.5, 137.9, 131.6, 130.2, 129.4, 127.2, 127.1, 126.5, 126.3, 123.8, 122.6, 121.9, 121.4, 121.3, 121.0, 119.6, 117.4, 116.7, 116.5, 113.4, 111.7, 108.4, 101.7, 94.9, 84.9, 82.6, 60.5, 49.8, 34.5, 29.0, 28.1. HRESIMS found m/z 629.2032 [M + H]+ (calcd for C36H29N4O7 629.2036).
Yellow solid (yield 52.1%). 1H NMR (600 MHz, DMSO‑d6): δ 11.14 (s, 1H), 9.26 (d, J = 8.0 Hz, 1H), 9.09 (d, J = 8.0 Hz, 1H), 8.05 (d, J = 8.0 Hz, 1H), 7.74 (d, J = 8.0 Hz, 1H), 7.62 (t, J = 8.0 Hz, 1H), 7.56 (t, J = 8.0 Hz, 1H), 7.46–7.38 (m, 2H), 7.07 (dd, J = 8.7, 6.2 Hz, 1H), 5.97 (s, 1H), 5.09–4.98 (m, 1H), 4.31 (s, 1H), 2.82 (s, 3H), 2.79–2.72 (m, 1H), 2.70 (s, 3H), 2.39 (s, 3H), 2.29 (td, J = 13.0, 6.2 Hz, 1H), 1.94 (s, 3H), 1.83 (s, 3H). 13C NMR (150 MHz, DMSO‑d6): δ 171.1, 170.9, 167.8, 146.9, 139.9, 137.7, 130.5, 128.7, 127.2, 126.8, 124.9, 124.9, 122.8, 121.4, 120.9, 120.7, 120.7, 119.6, 118.2, 116.1, 115.2, 113.7, 109.9, 95.0, 83.3, 82.4, 60.4, 47.7, 31.6, 29.3, 26.8, 26.1, 20.0. HRESIMS found m/z 563.2291 [M + H]+ (calcd for C33H31N4O5 563.2294).
Yellow solid (yield 46.4%). 1H NMR (600 MHz, DMSO‑d6): δ 11.15 (s, 1H), 9.26 (d, J = 8.0 Hz, 1H), 9.10 (d, J = 8.0 Hz, 1H), 8.05 (d, J = 8.0 Hz, 1H), 7.78–7.71 (m, 3H), 7.65–7.60 (m, 2H), 7.56 (t, J = 8.0 Hz, 1H), 7.47–7.37 (m, 5H), 7.25 (d, J = 15.4 Hz, 1H), 7.10 (dd, J = 8.8, 6.1 Hz, 1H), 5.18 (ddd, J = 13.0, 4.7, 2.5 Hz, 1H), 4.36 (s, 1H), 3.03 (s, 3H), 2.83–2.78 (m, 1H), 2.70 (s, 3H), 2.41 (s, 3H), 2.37 (td, J = 13.0, 6.1 Hz, 1H). 13C NMR (150 MHz, DMSO‑d6): δ 171.2, 170.9, 166.4, 142.3, 139.8, 137.7, 135.1, 130.6, 129.8, 129.0, 128.9, 128.8, 128.2, 128.2, 127.2, 126.9, 125.0, 124.9, 122.8, 121.5, 120.9, 120.7, 120.7, 119.6, 118.7, 116.1, 115.2, 113.6, 109.9, 95.0, 83.3, 82.4, 60.4, 48.4, 31.2, 29.2, 26.8. HRESIMS found m/z 611.2292 [M + H]+ (calcd for C37H31N4O5 611.2294).
A mixture of 7‑carbonyl staurosporine (N6, 10.0 mg, 0.021 mmol), succinic anhydride (3.2 mg, 0.032 mmol), and DMAP (1.0 mg) was placed in a 25 mL reaction flask. The reactants were dissolved in 3 mL of DMSO and stirred at 30 °C for 8 h. The reaction progress was monitored by TLC. Upon completion, saturated sodium bicarbonate solution was added, and the mixture was extracted with ethyl acetate (3 × equal volume) to remove the majority of DMSO. The combined organic layers were concentrated under reduced pressure. The crude product was purified by preparative HPLC using a gradient elution of 50–100% methanol in water (containing 0.05% TFA) as the mobile phase, at a flow rate of 10 mL/min, with UV detection at 318 nm.
Yellow solid (yield 45.5%). 1H NMR (600 MHz, DMSO‑d6): δ 12.09 (s, 1H), 11.14 (s, 1H), 9.26 (d, J = 8.0 Hz, 1H), 9.09 (d, J = 8.0 Hz, 1H), 8.03 (d, J = 8.0 Hz, 1H), 7.75 (d, J = 8.0 Hz, 1H), 7.62 (t, J = 8.0 Hz, 1H), 7.56 (t, J = 8.0 Hz, 1H), 7.45–7.38 (m, 2H), 7.09–7.04 (m, 1H), 5.01 (ddd, J = 13.1, 4.5, 2.5 Hz, 1H), 4.23 (s, 1H), 2.83 (s, 3H), 2.75–2.67 (m, 4H), 2.63–2.55 (m, 3H), 2.46–2.43 (m, 1H), 2.36 (s, 3H), 2.29 (td, J = 13.1, 6.2 Hz, 1H). 13C NMR (150 MHz, DMSO‑d6): δ 174.1, 172.0, 171.1, 170.9, 139.8, 137.7, 130.5, 128.7, 127.2, 126.9, 125.0, 124.9, 122.8, 121.4, 120.9, 120.7, 120.6, 119.6, 116.1, 115.2, 113.6, 109.8, 95.0, 83.2, 82.4, 60.4, 48.1, 30.8, 29.3, 29.0, 28.4, 26.8. HRESIMS found m/z 581.2037 [M + H]+ (calcd for C32H29N4O7 581.2036).
Yellow solid (yield 24.2%). 1H NMR (600 MHz, DMSO‑d6): δ 11.13 (s, 1H), 9.26 (d, J = 8.0 Hz, 1H), 9.09 (d, J = 8.0 Hz, 1H), 8.04 (d, J = 8.0 Hz, 1H), 7.73 (d, J = 8.0 Hz, 1H), 7.62 (t, J = 8.0 Hz, 1H), 7.56 (t, J = 8.0 Hz, 1H), 7.43 (t, J = 8.0 Hz, 1H), 7.40 (t, J = 8.0 Hz, 1H), 7.06 (dd, J = 8.8, 6.1 Hz, 1H), 5.06 (ddd, J = 13.1, 4.5, 2.4 Hz, 1H), 4.26 (s, 1H), 2.80 (s, 3H), 2.76–2.70 (m, 1H), 2.68 (s, 3H), 2.42–2.38 (m, 2H), 2.38 (s, 3H), 2.31 (t, J = 7.4 Hz, 2H), 2.27 (td, J = 13.1, 6.1 Hz, 1H), 1.78 (p, J = 7.4 Hz, 2H). 13C NMR (150 MHz, DMSO‑d6): δ 174.4, 172.5, 171.2, 170.9, 139.8, 137.6, 130.6, 128.7, 127.2, 126.9, 125.0, 124.9, 122.8, 121.4, 120.9, 120.7, 120.6, 119.6, 116.1, 115.2, 113.6, 109.8, 95.0, 83.3, 82.4, 60.4, 47.8, 33.0, 32.3, 30.8, 29.2, 26.8, 20.1. HRESIMS found m/z 595.2189 [M + H]+ (calcd for C33H31N4O7 595.2193).
Yellow solid (yield 19.7%). 1H NMR (600 MHz, Methanol‑d4): δ 9.25 (d, J = 8.0 Hz, 1H), 9.04 (d, J = 8.0 Hz, 1H), 7.83 (d, J = 8.0 Hz, 1H), 7.53–7.48 (m, 2H), 7.39 (d, J = 8.0 Hz, 1H), 7.34–7.29 (m, 2H), 6.76 (dd, J = 9.4, 4.4 Hz, 1H), 5.15 (ddd, J = 13.2, 5.6, 1.8 Hz, 1H), 4.01 (s, 1H), 2.86 (s, 3H), 2.74–2.67 (m, 1H), 2.46–2.41 (m, 3H), 2.40 (s, 3H), 2.37 (s, 3H), 2.34 (t, J = 6.7 Hz, 2H), 1.71–1.63 (m, 4H). 13C NMR (150 MHz, Methanol‑d4): δ 177.2, 175.8, 172.4, 172.2, 140.7, 139.0, 132.4, 130.7, 127.8, 127.7, 126.7, 126.5, 124.6, 123.2, 121.8, 121.6, 121.5, 120.4, 117.9, 116.8, 113.2, 109.7, 96.0, 85.5, 83.8, 60.5, 49.8, 34.5, 34.3, 31.6, 29.1, 28.5, 25.5, 25.4. HRESIMS found m/z 609.2347 [M + H]+ (calcd for C34H33N4O7 609.2349).
Yellow solid (yield 22.0%). 1H NMR (600 MHz, DMSO‑d6): δ 11.13 (s, 1H), 9.26 (d, J = 8.0 Hz, 1H), 9.09 (d, J = 8.0 Hz, 1H), 8.05 (d, J = 8.0 Hz, 1H), 7.73 (d, J = 8.0 Hz, 1H), 7.62 (t, J = 8.0 Hz, 1H), 7.57 (t, J = 8.0 Hz, 1H), 7.46–7.38 (m, 2H), 7.07 (dd, J = 8.8, 6.0 Hz, 1H), 5.00 (ddd, J = 13.0, 4.5, 2.4 Hz, 1H), 4.26 (s, 1H), 3.66–3.56 (m, 2H), 3.45–3.37 (m, 2H), 2.86 (s, 3H), 2.80–2.72 (m, 1H), 2.70 (s, 3H), 2.38 (s, 3H), 2.29 (td, J = 13.0, 6.0 Hz, 1H). 13C NMR (150 MHz, DMSO‑d6): δ 171.2, 171.1, 170.9, 169.1, 139.8, 137.7, 130.5, 128.7, 127.2, 126.9, 125.0, 125.0, 122.7, 121.4, 120.9, 120.7, 120.6, 119.6, 116.1, 115.2, 113.5, 109.9, 95.0, 83.1, 82.4, 60.4, 48.4, 34.2, 33.3, 31.4, 29.2, 26.5. HRESIMS found m/z 613.1761 [M + H]+ (calcd for C32H29N4O7S 613.1757).
Suberic acid (7.3 mg, 0.042 mmol) and HATU (11.8 mg, 0.031 mmol) were dissolved in 2 mL of DMF in a 25 mL reaction flask, followed by the addition of DIPEA (20 μL, 0.115 mmol). The mixture was stirred at 30 °C for 1 h. Subsequently, 7‑carbonyl staurosporine (N6, 10.0 mg, 0.021 mmol) was added, and the reaction was stirred at 65 °C for 8 h. The progress of the reaction was monitored by TLC. After completion, the reaction mixture was concentrated under reduced pressure, and the crude product was purified by preparative HPLC using 60% acetonitrile in water containing 0.05% TFA as the mobile phase, at a flow rate of 10 mL/min with detection at 318 nm, to afford compound P11.
Yellow solid (yield 24.2%). 1H NMR (600 MHz, DMSO‑d6): δ 11.96 (s, 1H), 11.13 (s, 1H), 9.26 (d, J = 8.0 Hz, 1H), 9.09 (d, J = 8.0 Hz, 1H), 8.04 (d, J = 8.0 Hz, 1H), 7.73 (d, J = 8.0 Hz, 1H), 7.62 (t, J = 8.0 Hz, 1H), 7.56 (t, J = 8.0 Hz, 1H), 7.43 (t, J = 8.0 Hz, 1H), 7.40 (t, J = 8.0 Hz, 1H), 7.06 (dd, J = 8.6, 6.3 Hz, 1H), 5.06 (ddd, J = 13.5, 4.4, 2.4 Hz, 1H), 4.25 (s, 1H), 2.81 (s, 3H), 2.75–2.69 (m, 1H), 2.68 (s, 3H), 2.37 (s, 3H), 2.36–2.32 (m, 2H), 2.29–2.24 (m, 1H), 2.21 (t, J = 7.3 Hz, 2H), 1.59–1.53 (m, 2H), 1.53–1.47 (m, 2H), 1.35–1.25 (m, 4H). 13C NMR (150 MHz, DMSO‑d6): δ 174.6, 172.9, 171.2, 170.9, 139.9, 137.7, 130.5, 128.7, 127.2, 126.9, 125.0, 124.9, 122.8, 121.4, 120.9, 120.7, 120.6, 119.6, 116.1, 115.2, 113.5, 109.8, 95.0, 83.3, 82.4, 60.4, 47.8, 33.7, 33.0, 30.9, 29.2, 28.5, 28.5, 26.8, 24.5, 24.4. HRESIMS found m/z 637.2671 [M + H]+ (calcd for C36H37N4O7 637.2662).
A mixture of compound P8 (12.0 mg, 0.021 mmol) and HATU (12.2 mg, 0.032 mmol) was dissolved in 2 mL of DMF in a 25 mL reaction flask. DIPEA (20 μL, 0.115 mmol) was then added, and the resulting solution was stirred at 30 °C for 1 h. Subsequently, 3-aminopyrazole (2.0 mg, 0.024 mmol) was added, and the reaction mixture was stirred at 65 °C for 8 h. The reaction progress was monitored by TLC. After completion, the reaction mixture was concentrated under reduced pressure. The crude product was purified by preparative HPLC using a mobile phase of 65% acetonitrile in water at a flow rate of 10 mL/min, with detection at 318 nm, affording compound P18.
Yellow solid (yield 12.4%). 1H NMR (600 MHz, Methanol‑d4): δ 9.28 (d, J = 8.0 Hz, 1H), 9.08 (d, J = 8.0 Hz, 1H), 7.83 (d, J = 8.0 Hz, 1H), 7.58–7.49 (m, 3H), 7.43 (d, J = 8.0 Hz, 1H), 7.34 (t, J = 8.0 Hz, 2H), 6.80 (dd, J = 9.1, 4.3 Hz, 1H), 6.51 (s, 1H), 5.15 (dd, J = 13.4, 5.5 Hz, 1H), 4.07 (s, 1H), 2.93 (s, 3H), 2.81–2.70 (m, 5H), 2.50–2.45 (m, 1H), 2.45–2.43 (m, 3H), 2.40 (s, 3H). 13C NMR (150 MHz, Methanol‑d4): δ 174.8, 172.6, 172.4, 172.3, 154.7, 140.8, 139.1, 132.4, 130.8, 127.9, 127.7, 126.7, 126.5, 124.7, 123.3, 121.9, 121.7, 121.5, 121.1, 120.5, 117.9, 116.9, 113.3, 109.8, 96.1, 92.7, 85.4, 83.9, 60.5, 49.9, 31.7, 31.5, 29.6, 29.2, 28.4. HRESIMS found m/z 646.2413 [M + H]+ (calcd for C35H32N7O6 646.2414).
Compound P8 (15.0 mg, 0.026 mmol) and CDI (8.4 mg, 0.052 mmol) were dissolved in 2 mL of DMF in a 25 mL reaction vessel and stirred at 30 °C for 1 h. Hydroxylamine hydrochloride (7.2 mg, 0.104 mmol) was then added, and the reaction mixture was stirred at 30 °C for 8 h. The progress of the reaction was monitored by TLC. After completion, the reaction mixture was concentrated under reduced pressure, and the crude product was purified by preparative HPLC using a mobile phase of 58% acetonitrile in water containing 0.05% TFA at a flow rate of 10 mL/min, with UV detection at 318 nm, to afford compound P19.
Yellow solid (yield 14.0%). 1H NMR (600 MHz, DMSO‑d6): δ 11.14 (s, 1H), 10.43 (d, J = 1.4 Hz, 1H), 9.26 (d, J = 8.0 Hz, 1H), 9.09 (d, J = 8.0 Hz, 1H), 8.70 (d, J = 1.4 Hz, 1H), 8.03 (d, J = 8.0 Hz, 1H), 7.74 (d, J = 8.0 Hz, 1H), 7.62 (t, J = 8.0 Hz, 1H), 7.56 (t, J = 8.0 Hz, 1H), 7.46–7.37 (m, 2H), 7.06 (dd, J = 8.8, 6.0 Hz, 1H), 5.03 (ddd, J = 13.5, 4.6, 2.4 Hz, 1H), 4.24–4.18 (m, 1H), 2.82 (s, 3H), 2.76–2.66 (m, 4H), 2.64–2.55 (m, 3H), 2.36 (s, 3H), 2.32–2.25 (m, 2H). 13C NMR (150 MHz, DMSO‑d6): δ 172.0, 171.2, 170.9, 168.7, 139.8, 137.7, 130.6, 128.7, 127.2, 126.9, 125.0, 124.9, 122.8, 121.5, 121.0, 120.7, 120.7, 119.6, 116.1, 115.2, 113.5, 109.9, 95.0, 83.3, 82.4, 60.4, 48.0, 30.8, 29.2, 28.5, 27.4, 26.8. HRESIMS found m/z 596.2145 [M + H]+ (calcd for C32H30N5O7 596.2145).
Yun Huang: Writing – original draft, Methodology, Data curation, Conceptualization. Yijun Ma: Methodology, Data curation. Jiebin Fang: Methodology, Data curation. Xingzhi Gong: Methodology, Data curation. Lei Miao: Methodology, Investigation. Ningjing Zhang: Validation, Methodology. Shijie Zou: Validation, Methodology. Zhangyun Fang: Validation, Methodology. Churu Mao: Validation, Methodology. Jinfang Lou: Writing – review & editing. Huifang Zhao: Methodology, Investigation. Xiaofeng Zhao: Writing – review & editing. Wanjing Ding: Writing – review & editing, Supervision, Methodology. Zhongjun Ma: Writing – review & editing, Supervision, Project administration, Conceptualization.
This study was conducted in accordance with the ARRIVE (Animal Research: Reporting of In Vivo Experiments) guidelines. This study was approved by the Institutional Animal Care and Use Committee (IACUC) of Zhejiang University.
During the preparation of this manuscript, the authors used OpenAI's ChatGPT to assist with improving the clarity, grammar, and flow of the English text. The tool was employed solely for language editing purposes and did not contribute to the scientific content, data analysis, or interpretation. No AI or AI-assisted tools were used to generate or alter any images or figures. The authors take full responsibility for the content and integrity of the manuscript.
来源 查看原文
版权申明 本网站立足国家海洋药物和生物制品产业联盟,致力于打造海洋生物医药“产学研用”一站式、综合性资讯共享服务平台,促进我国海洋药物和功能制品“资源链、科技链、产业链、应用链”协同创新、深度融合发展。本文转载自原文来源。版权归原作者及原来出处所有,部分文章未能联系到原作者,在此深表歉意。如涉及版权问题,请留言联系我们协商处理(邮箱:czhang@tio.org.cn),侵权内容将即刻删除。
免责声明 本文仅代表作者个人观点,与本平台立场无关。本站不对内容真实性、完整性、时效性作保证,仅供参考,请读者自行核实。